Model accuracy: Denver example
How close is the Designer’s estimate to what the panel actually makes, day by day, and is it getting closer?
MODEL ACCURACYDay by day
| Day | Sun hours | Estimate Wh | Measured Wh | Measured vs estimate | Old baseline Wh |
|---|---|---|---|---|---|
| Wed Oct 28 | 6.09 | 762 | 681 | -10.6 % | 781 |
| Thu Oct 29 | 5.73 | 717 | 801 | +11.7 % | 735 |
| Fri Oct 30 | 5.54 | 693 | 754 | +8.8 % | 710 |
| Sat Oct 31 | 3.54 | 443 | 414 | -6.5 % | 454 |
| Sun Nov 01 | 2.31 | 316 | 306 | -3.2 % | 311 |
| Mon Nov 02 | 0.41 | 56 | 50 | -10.7 % | 55 |
| Tue Nov 03 | 4.97 | 680 | 677 | -0.4 % | 669 |
| Wed Nov 04 | 4.47 | 612 | 646 | +5.6 % | 602 |
| Thu Nov 05 | 5.98 | 818 | 852 | +4.2 % | 805 |
| Fri Nov 06 | 5.19 | 710 | 736 | +3.7 % | 699 |
| Sat Nov 07 | 6.58 | 901 | 857 | -4.9 % | 886 |
| Sun Nov 08 | 6.53 | 894 | 851 | -4.8 % | 879 |
| Mon Nov 09 | 6.55 | 896 | 837 | -6.6 % | 882 |
| Tue Nov 10 | 4.79 | 656 | 676 | +3.0 % | 645 |
| Wed Nov 11 | – | – | 826 | – | – |
Nov 11: measured only; Golden’s sunlight for that day isn’t loaded yet, so it has no estimate and is left out of the comparison.
Single days miss more than the total because Golden is about 15–20 miles away: a cloud over one and not the other moves a day up to 10–12 %. Over a week it evens out.
How a day is estimated
Estimate = sun hours × the panel’s Wh per sun hour. Worked for Nov 5:
- How sunny was it? Golden’s sensor, mounted vertical and facing south like the panel, measured
5.98 sun hours
- How much does the balcony panel make per sun hour? From the model for November (shade, losses and inverter included):
136.9 Wh per sun hour
- Estimate
5.98 × 136.9 = 819 Wh
- Check against the panel
measured 852 Wh vs estimated 819 Wh = +4.0 %
The model’s number changes month to month: as the sun gets lower, the vertical panel catches it more squarely and the building shade shifts. The measured number is shown only to compare; the estimate never uses it.
Where the numbers come from
- Sun hours: Golden (NLR Solar Radiation Research Laboratory) logs sunlight every minute. Nov 5: 1,440 readings add up to 358,985 W/m²·min; ÷ 60 ÷ 1,000 = 5.98 kWh/m², which is 5.98 sun hours. Sensor: 90-South PSP.
- Wh per sun hour: the Designer (Fit 1, v323, typical-year weather) expects 21.3 kWh in November = 711 Wh a day, from 5.20 sun hours a day on the panel with open sky: 711 ÷ 5.20 = 136.9. October: 598 ÷ 4.78 = 125.1.
- Old baseline, same steps with the Oct 28 report (21 kWh in November, 5.20 sun hours): 134.6 Wh per sun hour × 5.98 = 806 Wh.
- Limits: temperature and wind are typical-year, not that day’s; Golden has open sky and no building shade.
Every day, same steps
| Day | Sun hours | Wh per sun hour | Estimate Wh | Measured Wh | Measured vs estimate |
|---|---|---|---|---|---|
| Wed Oct 28 | 6.09 | × 125.1 | = 762 | 681 | -10.6 % |
| Thu Oct 29 | 5.73 | × 125.1 | = 717 | 801 | +11.7 % |
| Fri Oct 30 | 5.54 | × 125.1 | = 693 | 754 | +8.8 % |
| Sat Oct 31 | 3.54 | × 125.1 | = 443 | 414 | -6.5 % |
| Sun Nov 01 | 2.31 | × 136.9 | = 316 | 306 | -3.2 % |
| Mon Nov 02 | 0.41 | × 136.9 | = 56 | 50 | -10.7 % |
| Tue Nov 03 | 4.97 | × 136.9 | = 680 | 677 | -0.4 % |
| Wed Nov 04 | 4.47 | × 136.9 | = 612 | 646 | +5.6 % |
| Thu Nov 05 | 5.98 | × 136.9 | = 818 | 852 | +4.2 % |
| Fri Nov 06 | 5.19 | × 136.9 | = 710 | 736 | +3.7 % |
| Sat Nov 07 | 6.58 | × 136.9 | = 901 | 857 | -4.9 % |
| Sun Nov 08 | 6.53 | × 136.9 | = 894 | 851 | -4.8 % |
| Mon Nov 09 | 6.55 | × 136.9 | = 896 | 837 | -6.6 % |
| Tue Nov 10 | 4.79 | × 136.9 | = 656 | 676 | +3.0 % |
Model history
| From | Model | What changed | Year | Oct | Nov | Measured vs estimate |
|---|---|---|---|---|---|---|
| Oct 28, 2026 | Old baseline · v321 | Original report, as designed | 188 kWh | 19 | 21 | +0.3 % |
| Nov 9, 2026 | v323 | Altitude in the clear-sky model (clear-day chart only) | no change to the estimate | |||
| Nov 11, 2026 | Fit 1 · v323 | Photo alignment refined from measured clear days: facing 178°, photo +2° / +1° / ×0.96 | 187.9 kWh | 18.6 | 21.3 | −0.2 % |
| Nov 12, 2026 | Fit 1 · v325 | Same alignment; the report’s skyline redrawn so it sits on the buildings in the photo (the v324 drawing had drifted off them) | 189 kWh | 19 | 21 | daily check unchanged |
The old baseline stays as issued, so the record shows what was promised before the panel ran. On the same tool, the fit itself lowered the yearly estimate 1.6 %.
How Fit 1 was found
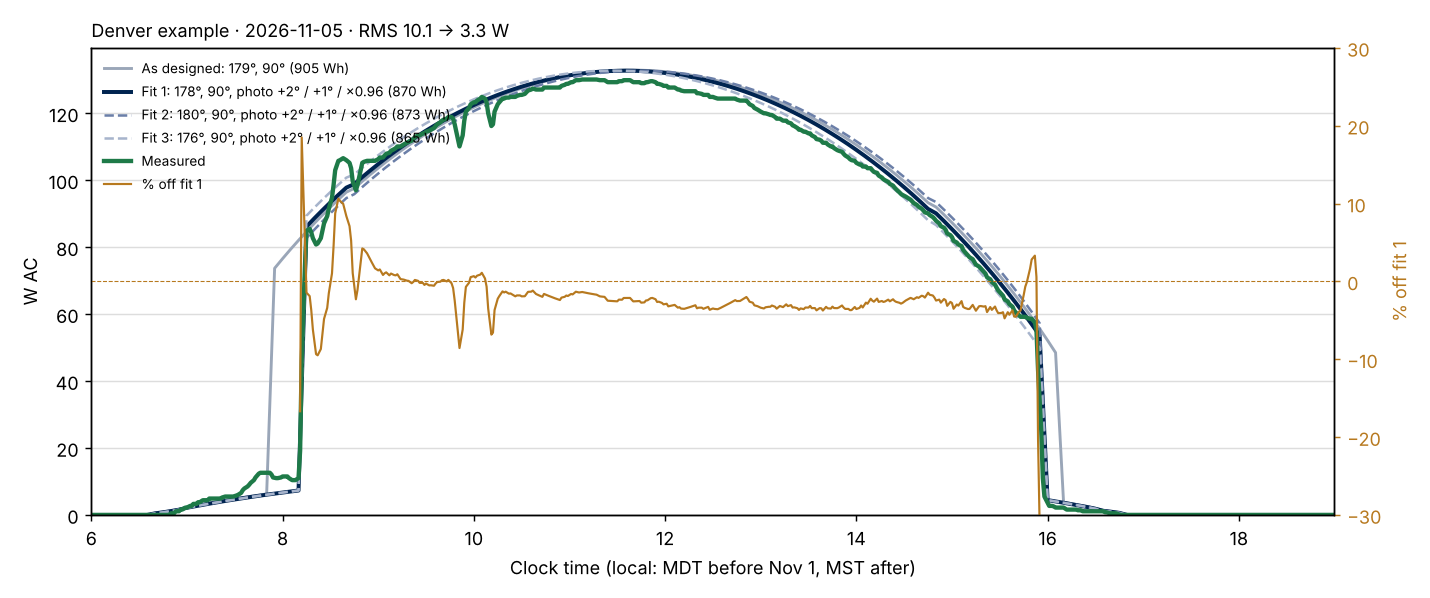
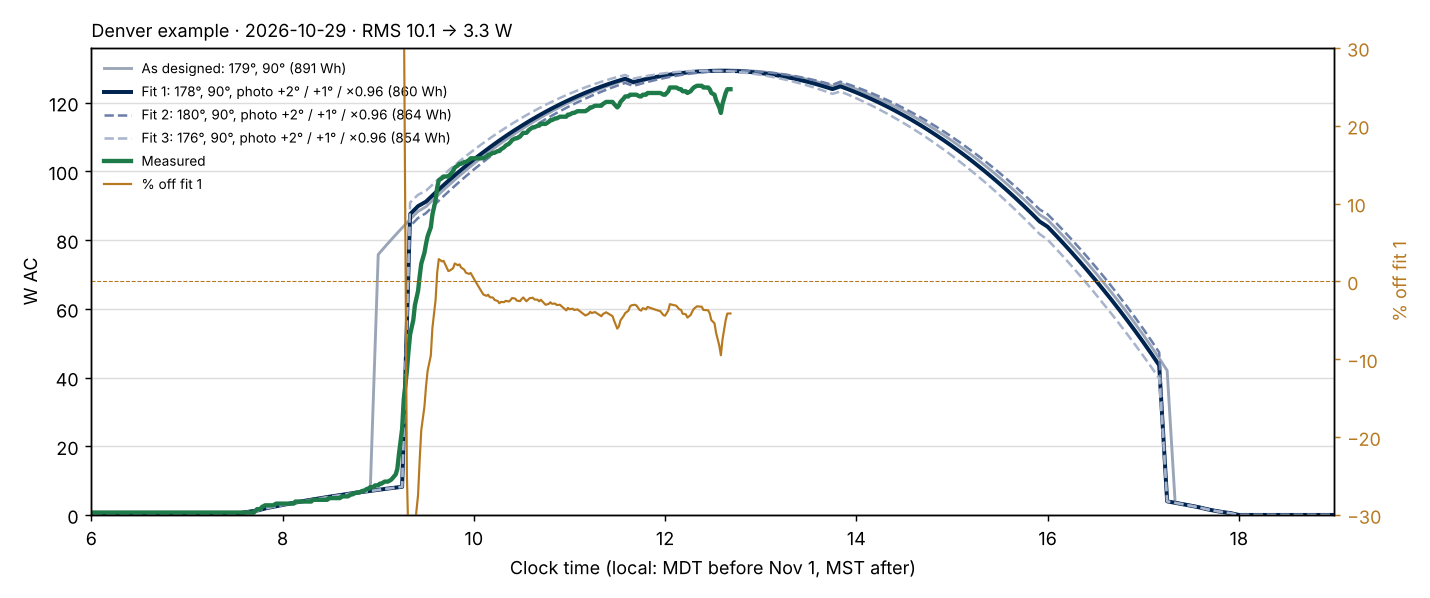
75,330 runs of the Designer’s own clear-day model, each scored against the inverter’s curve on clear days. The three closest are below; Fit 1 is now the model.
| Facing | Tilt | Photo rotation / level / width | RMS error | Shade edges | Model vs measured | Nov 5 day total | |
|---|---|---|---|---|---|---|---|
| As designed | 179° | 90° | 0° / 0° / ×1.00 | 10.1 W | up to 20 min off | 6.2 % high | 905 Wh |
| Fit 1 | 178° | 90° | +2° / +1° / ×0.96 | 3.3 W | within 2 min | 2.1 % high | 870 Wh |
| Fit 2 | 180° | 90° | +2° / +1° / ×0.96 | 3.5 W | within 2 min | 1.8 % high | 873 Wh |
| Fit 3 | 176° | 90° | +2° / +1° / ×0.96 | 3.5 W | within 2 min | 2.2 % high | 865 Wh |
| Measured | 854 Wh (chart) · 852 Wh (CSV) |
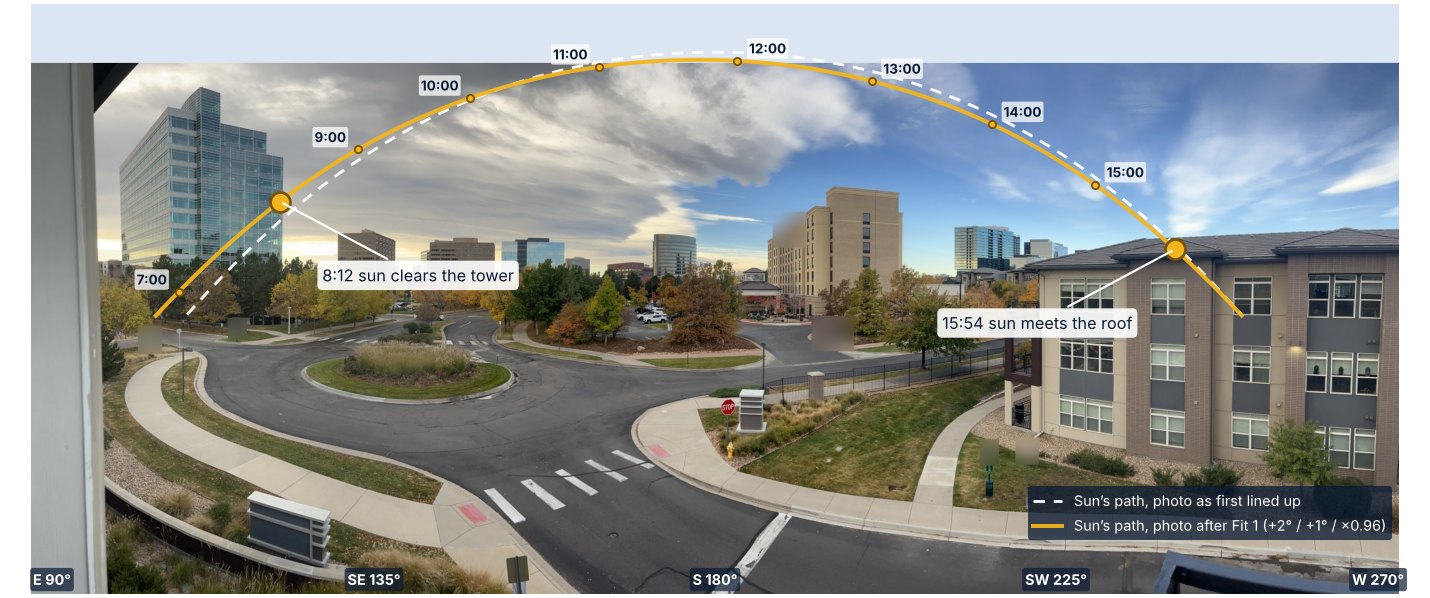
What the fit does, why, and how it is used
The Designer’s estimate rests on a few things set by hand: which way the panel faces, its tilt, and how the site photo is lined up with the compass. A small slip in any of them moves the shade edges by many minutes and the day’s energy by several percent. The fit checks those settings against what the panel actually did.
- Answer key. A cloudless day from the inverter’s own export (Nov 5 full day, Oct 29 morning), plus shade-edge times read off the app charts (Oct 28, Nov 7). Clouds would hide the geometry, so only clear days are used.
- Every combination. Five knobs, each swept across its range: facing (±10°), tilt (80–90°), photo rotation (±5°), photo level (±2°) and photo width (±5 %). A coarse grid first, then a fine grid around each leading answer: 75,330 runs of the Designer’s own clear-day model, about 10 minutes.
- Score. Each run’s curve is compared with the measured curve minute by minute (RMS error, in watts), with the misses at the shade edges (in minutes) counted in. Lower is better.
- Top three. Near-identical combinations are grouped, and the three best distinct answers are shown below. An answer is listed only if it scores within 15 % of the best.
What it determines
- Was the panel installed as designed? Facing and tilt. Here all three answers say vertical, facing 176–180°, so yes.
- Is the photo lined up right? Rotation, level and width set when the shade arrives and leaves. Fit 1 moved the morning edge from about 20 minutes off to within 2.
- What is left over? There is no catch-all “fudge” knob. Whatever the five knobs can’t explain (about 2 % here) is reported as a gap, and it tests the loss and inverter assumptions.
How it is used
- The best answer, Fit 1, became the site’s settings. It drives the updated Denver report and the daily estimates in the accuracy log (sun hours × Wh per sun hour).
- The original design stays on record as the old baseline, so the gain is visible.
- For the tool, it shows which inputs matter most. Photo alignment matters more than panel facing, which is where the Designer’s photo step should guide users.
What the result says
- The panel is where the design says: vertical, facing 176–180°. All three answers agree; the facing can’t be pinned closer than that yet.
- The old 80.5° lean-back is gone. The Oct 29 fit leaned the panel back to make up for a clear-sky model that ran low at Denver’s altitude. With the altitude correction in the tool, the vertical panel fits as built.
- Tilt sits on the sweep limit (90°). The range stops at vertical; a phone level on the panel face would close this out.
- Remaining gap about 2 % high: inside the panel’s ±5 % nameplate tolerance; no knob absorbs it. Air temperature is still a flat 20 °C (see Method).
- Photo knobs settled together: rotation +2°, level +1°, width ×0.96, now that three edges pin them.
75,330 combinations, coarse sweep then a fine sweep around each leader, about 10 minutes.
Clear-day curves: Nov 5 and Oct 29
Shade edges
| Day | Edge | Measured | From | Fit 1 off by |
|---|---|---|---|---|
| Oct 29 | Morning, building to the left | 9:19 MDT | chart curve | in the RMS |
| Nov 5 | Morning / evening | 8:12 / 15:54 MST | chart curve | in the RMS |
| Oct 28 | Evening, roofline to the west | 17:14 MDT (±5) | app chart, by eye | 2 min |
| Nov 7 | Morning, building to the left | 8:12 MST (±4) | app chart, by eye | 1 min |
| Nov 7 | Evening, roofline to the west | 15:54 MST (±4) | app chart, by eye | 1 min |
- Morning edge (vertical building edge) checks the photo’s rotation; evening edge (near-flat roofline) checks its level.
- All by-eye edges land within their reading error (±4 to ±5 min).
Supporting evidence
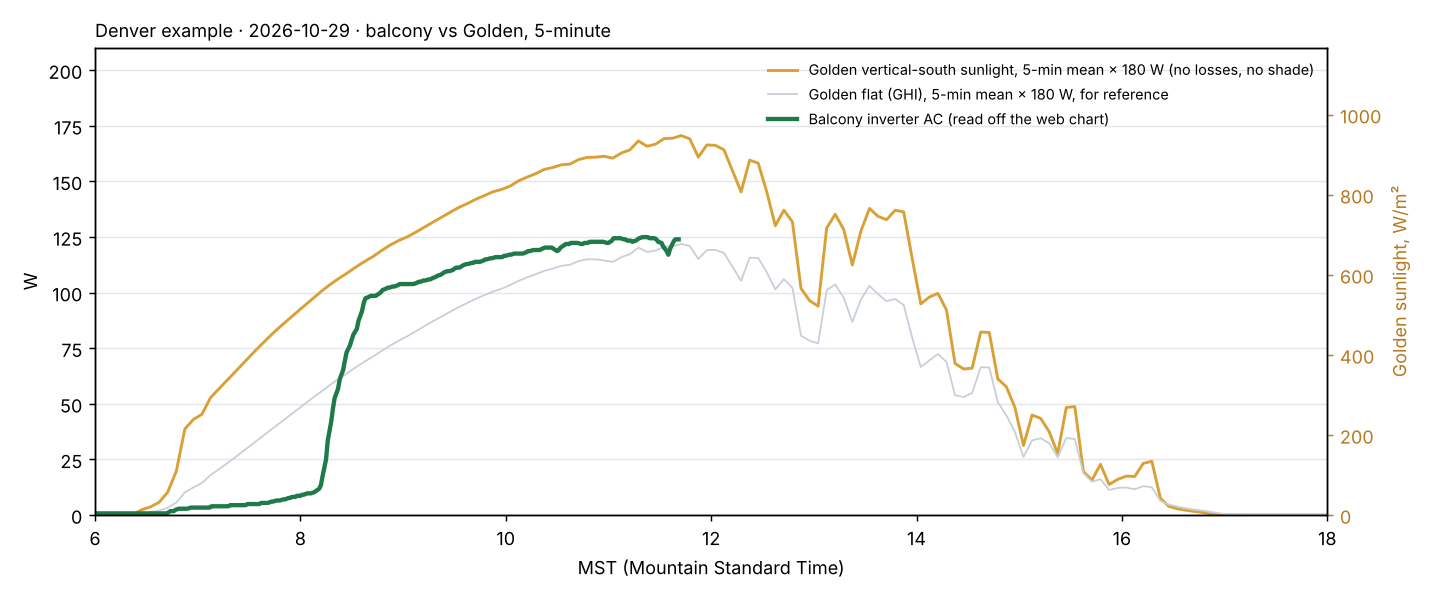
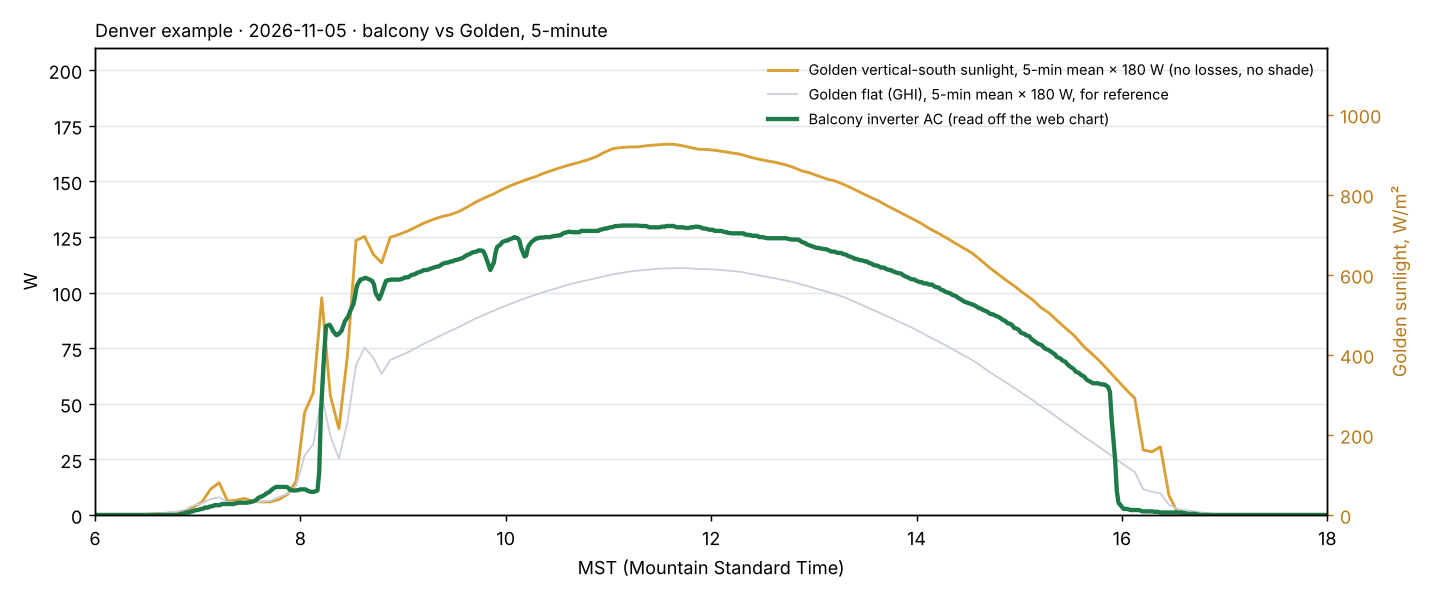
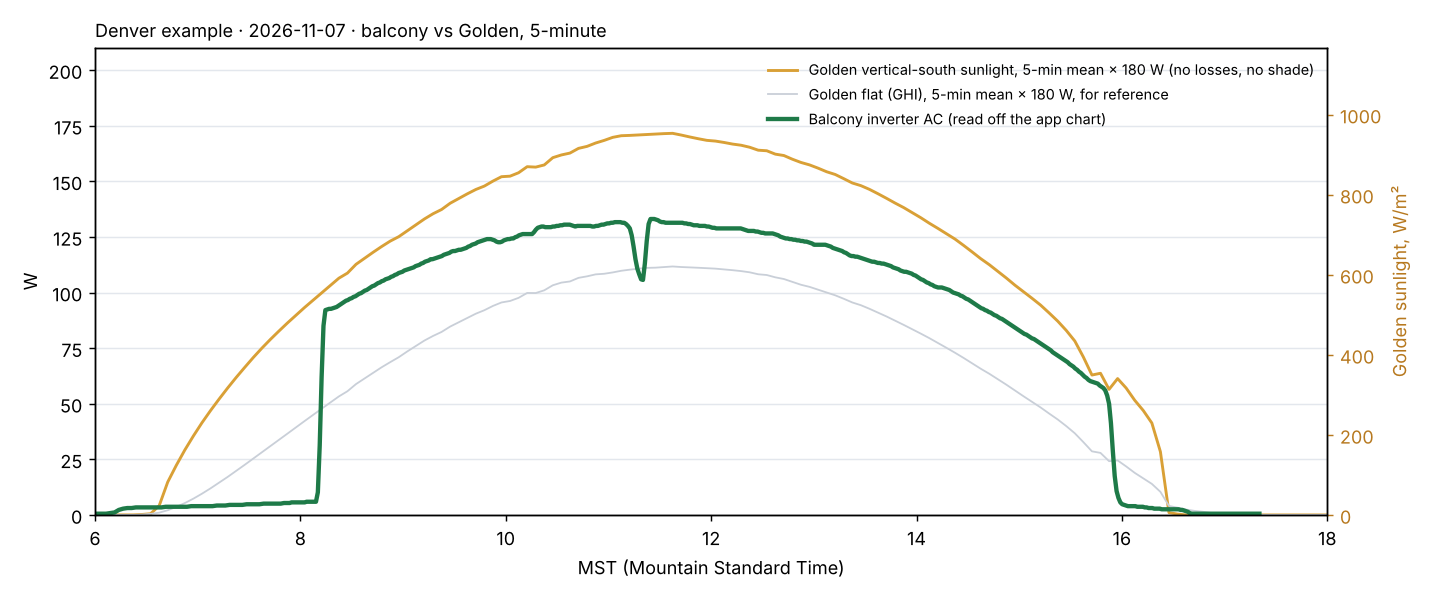
Balcony vs Golden, 5-minute curves and the time lag
Golden’s 1-minute readings averaged to the inverter’s 5-minute steps, scaled by the 180 W nameplate (1,000 W/m² = 180 W), on the same clock (MST). The gap between gold and green is everything between sunlight and the outlet: heat, wiring, inverter, glass angle, and the balcony’s shade.
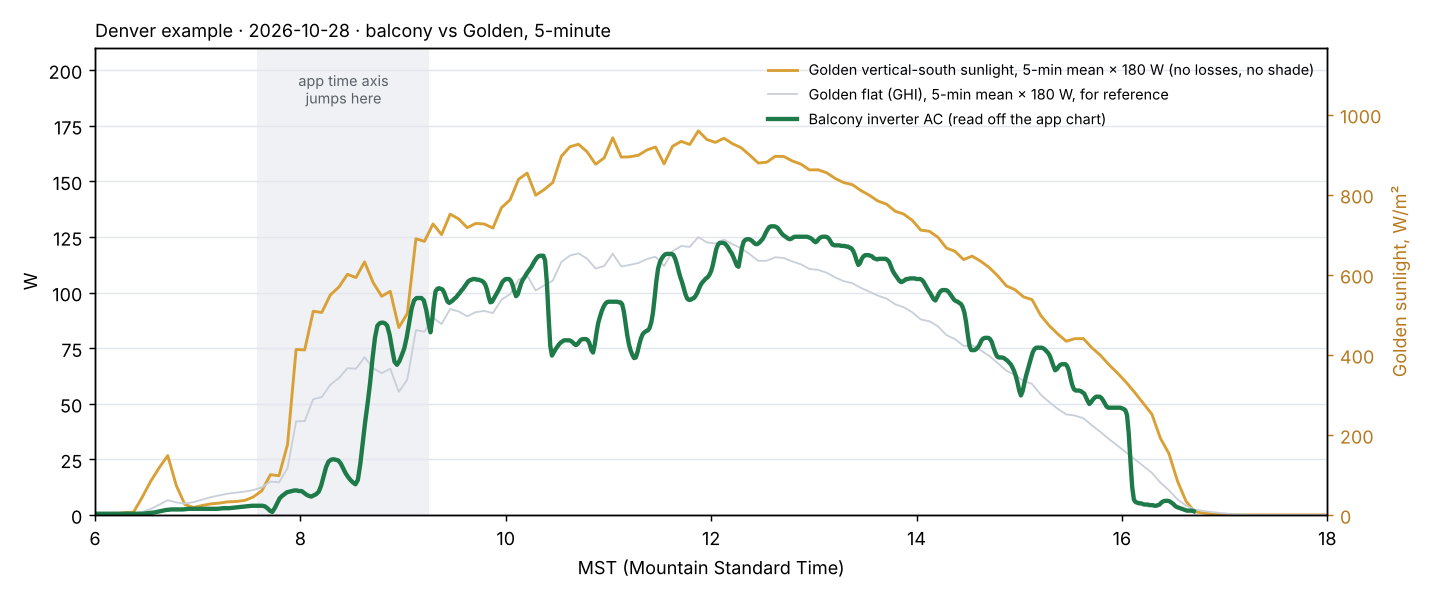
| Day | Balcony ÷ (Golden × 180 W), 10:30–13:30 MST median | Gap |
|---|---|---|
| Wed Oct 28 | 0.70 | 30 % |
| Thu Oct 29 | 0.77 | 23 % |
| Thu Nov 05 | 0.79 | 21 % |
| Sat Nov 07 | 0.78 | 22 % |
- Clear days agree: at midday the balcony delivers 0.77–0.79 of Golden’s sunlight × nameplate, three different days. Oct 28’s 0.71 is its clouds.
- Source curves: Oct 29 and Nov 5 from the maker’s web chart; Oct 28 and Nov 7 read off app screenshots. The 5-minute CSV export would replace all four with exact values.
Cloud lag, Golden to balcony
| Day | Best-matching shift | Match (r) | Why |
|---|---|---|---|
| Wed Oct 28 | -20 min | 0.29 | broken cloud at the balcony, little at Golden |
| Thu Oct 29 | -41 min | 0.16 | clear: no cloud features to match |
| Thu Nov 05 | +2 min | 0.47 | clear: no cloud features to match |
| Sat Nov 07 | +59 min | 0.47 | clear: no cloud features to match |
- Not measurable yet. Each day’s Golden curve was slid ±60 min against the balcony’s (slow trends removed, so only cloud dips count). No shift matches well (r 0.16–0.47) and the best shifts disagree (−41 to +59 min): there’s nothing shared to line up.
- Clocks agree: on clear days the shade edges land within 1–2 min of the sun’s position, so no time correction is applied to the overlays.
- What would measure it: partly cloudy days where the same cloud field crosses both (Golden shows candidates on Oct 30–Nov 4) with the inverter’s 5-minute export. Each matched day adds one lag reading; the lag is applied once several agree.
Sun hours vs production, all days
133 Wh per Golden sun hour; Golden’s sunlight explains 95 % of the day-to-day swing (14 days; darker dots are clear days).
Next
- Inverter 5-minute exports for the partly cloudy days, Nov 6 and Nov 10 among them (measures the Golden-to-balcony lag).
- Designer run hour by hour on Golden’s weather (that day’s temperature and wind, not typical).
- Golden’s sunlight for Nov 11, to bring that day into the comparison.
- Monthly roll-up when November closes.
Reference
Knobs
Each knob has a value, a range and a lock. Locked knobs stay put; the sweep moves the rest. Only things that can be checked on site.
| Knob | Default | Sweep range | Lock | How to check |
|---|---|---|---|---|
| Panel facing | design (179°) | ±10° | unlocked | Compass on the panel face, true north |
| Panel tilt | design (90°) | 80–90° | unlocked | Phone level on the panel face |
| Photo rotation | 0° | ±5° | unlocked | Panorama facing; horizon tap |
| Photo level | 0° | ±2° | unlocked | Level line; horizon tap |
| Photo width | ×1.00 | ±5 % | unlocked | Horizon tap at a known bearing |
- Result: up to three distinct answers; near-identical combinations are grouped; one answer when the rest score more than 15 % worse.
- No catch-all efficiency or scale knob. What the knobs can’t explain is reported as the energy gap.
Loss items
Settings, not swept. Defaults are the Designer’s PVWatts values; change one only with a checkable reason.
| Item | Default | Source | Check on site |
|---|---|---|---|
| Soiling | 2 % | PVWatts V5 | Panel clean or new |
| Wiring | 2 % | PVWatts V5 | Cable length and gauge |
| Mismatch | 2 % | PVWatts V5 | Modules sharing one input (one module: nothing to mismatch) |
| Connections | 0.5 % | PVWatts V5 | Connector count |
| Light-induced degradation | 1.5 % | PVWatts V5 | Cell type and age |
| Nameplate | 1 % | PVWatts V5 | Flash test; nameplate tolerance |
| Clear-day total | 8.7 % | Product of the items. The annual estimate adds 3 % availability (11.3 %). | |
Inverter efficiency
Default: PVWatts part-load curve at 96 % nominal. Load is a share of the inverter’s DC rating (360 VA ÷ 0.96 = 375 W).
| Load | 5 % | 10 % | 20 % | 30 % | 50 % | 75 % | 100 % |
|---|---|---|---|---|---|---|---|
| DC watts | 19 | 38 | 75 | 113 | 188 | 281 | 375 |
| Efficiency | 86.4 % | 92.2 % | 94.9 % | 95.8 % | 96.2 % | 96.2 % | 96.0 % |
- This site runs at part load: a 180 W panel peaks near 32 % of the inverter’s rating, so most of the day sits on the steep part of the curve.
- Next: replace the curve with measured efficiency by power range (e.g. CEC test points for this inverter) when available.
Method
- Model: the Designer’s own clear-day model and sun math, run unchanged for every combination.
- Score: RMS of measured minus model, 5-minute points, plus shade-edge timing from other days.
- Sweep: coarse grid over unlocked knobs, then a fine grid around each leading answer.
- Altitude: clear-sky beam corrected for site elevation (Laue 1970), the same correction now in the Designer.
- Air temperature: 20 °C assumed until hourly weather is loaded.
Sources
- Dobos, A. (2014), PVWatts Version 5 Manual, NREL/TP-6A20-62641: losses, glass reflection, cell temperature, inverter curve.
- Perez, R. et al. (1990), sky diffuse model.
- Laue, E. G. (1970), altitude correction for clear-sky beam irradiance, Solar Energy 13.
- Reno, M. & Hansen, C. (2016), clear-sky period detection, Renewable Energy 90 (planned for picking clear days).
Sun Safe LLC · solar research and development, Rutland, Vermont · Home · Sources · Site version v326 · November 14, 2026