Test article
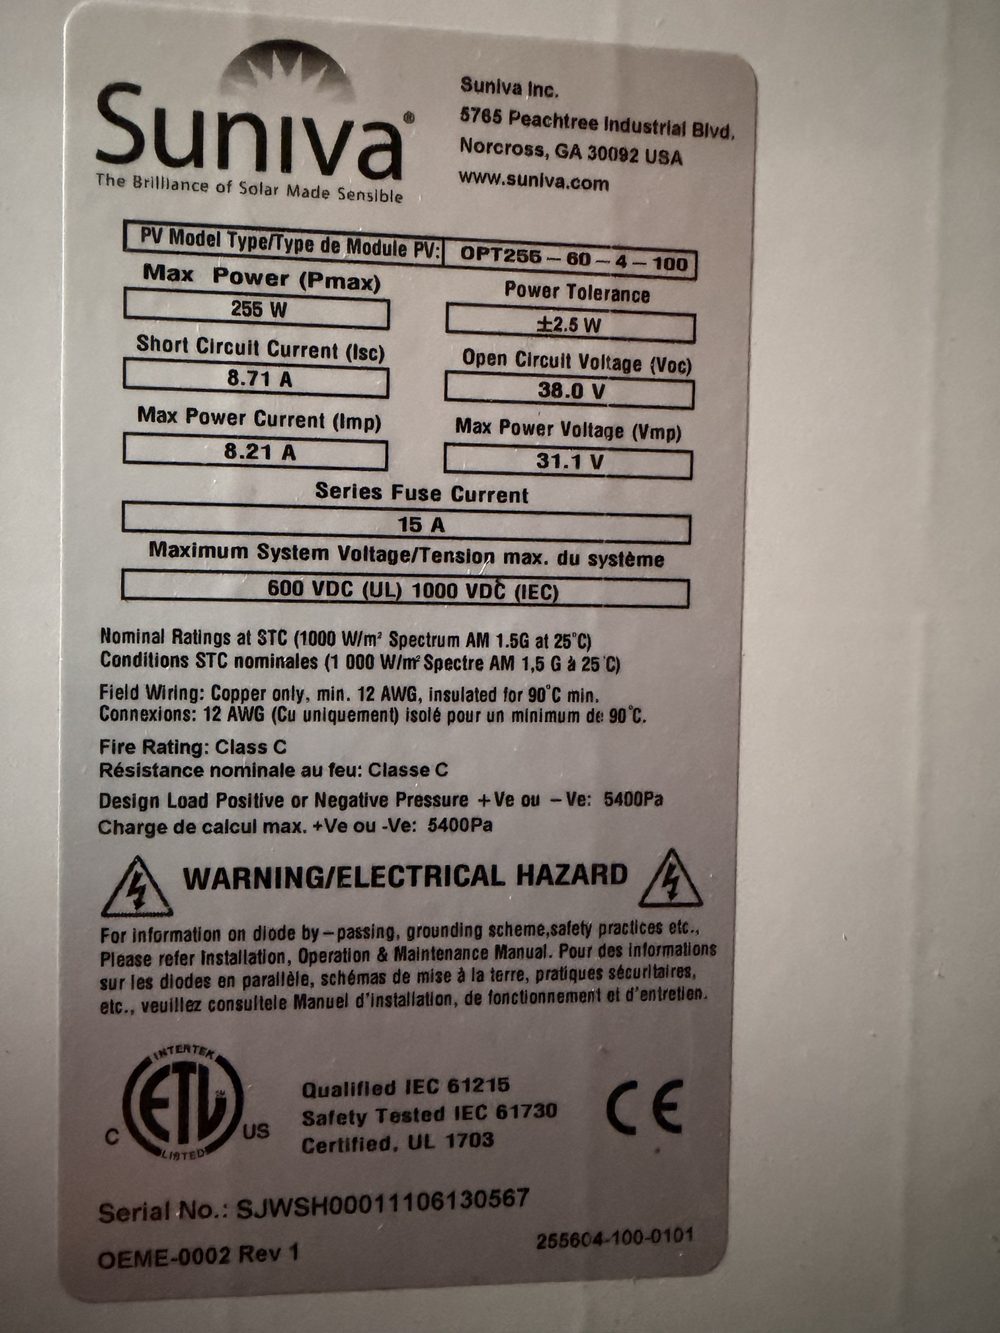
Module
| Model | Suniva OPT255-60-4-100 |
|---|---|
| Cells | 60 |
| Pmax | 255 W |
| Isc | 8.71 A |
| Voc | 38.0 V |
| Imp | 8.21 A |
| Vmp | 31.1 V |
| β Voc | −0.127 V/°C (−0.335 %/°C × 38.0 V; coefficient from the Suniva Optimus datasheet [20]) |
| Serial | SJWSH00011106130567 |
| Source | Nameplate on the back of the test unit (photo) |
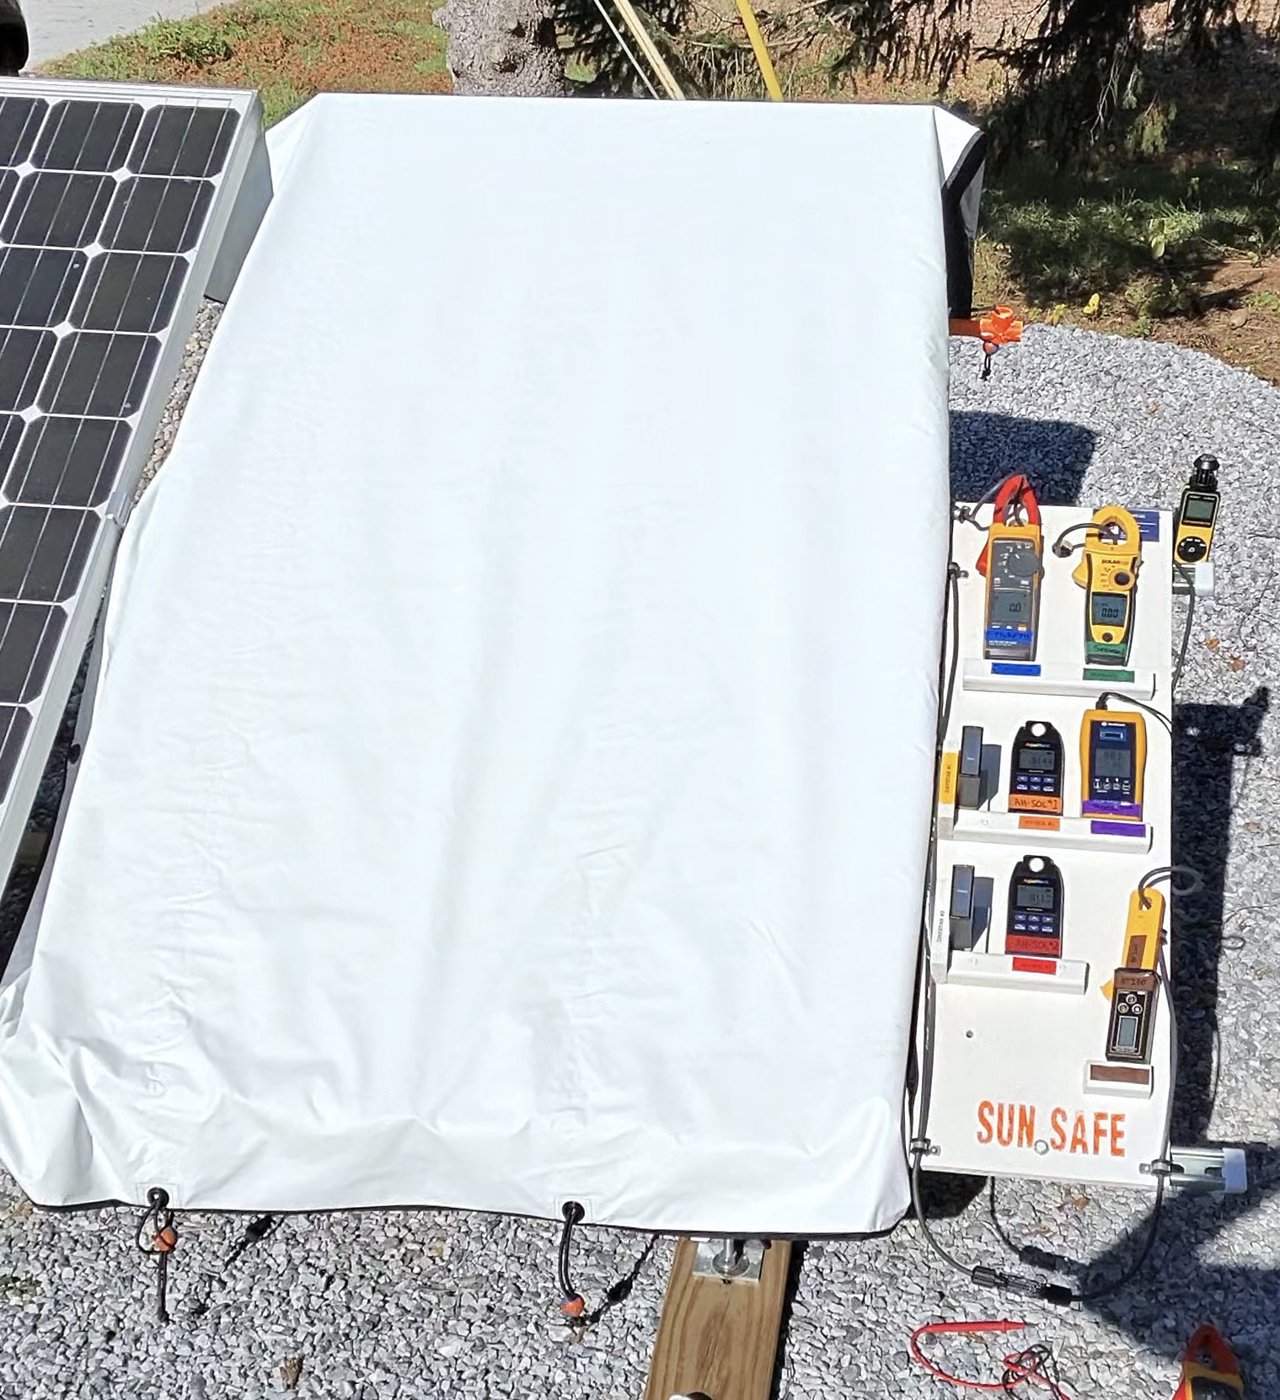
Sheet
- Prototype unit 004
- Multi-layer irradiance suppression
- Deployed over the full module face, short in place
- Measurements taken with the sheet on and the short in place, after a 10 s hold
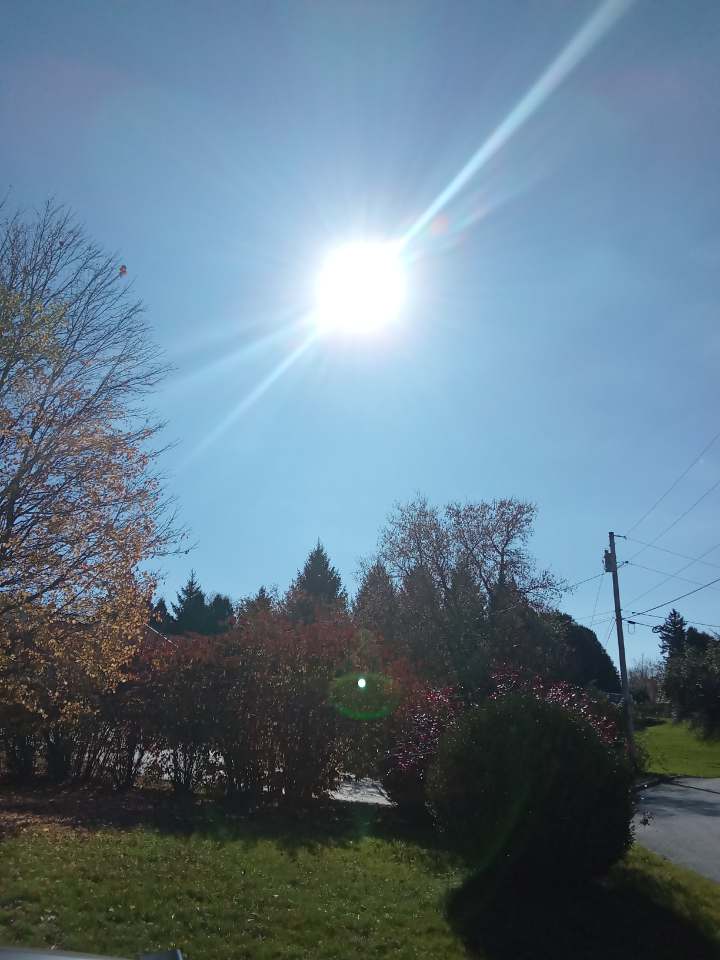
Conditions
- Stable irradiance ≥ 800 W/m² (NOCT test irradiance)
- Low wind: gusts ≤ 12 m/s
- Dry: modules and sheet dry
- Measurements taken only in these conditions; ambient confirmed on both reference meters with the sheet on
Procedure
- 1 · Identify Trial #, date, video file, tilt, azimuth, sheet unit and condition.
- 2 · Conditions Start/end time, wind, modules dry; Voc baseline taken before the short and sheet; ambient on both reference meters ≥ 800 W/m².Photo 1: sky / sun, before the short and sheet.
- 3 · Baseline Module shorted, no sheet: shorted current on three clamps, ambient and module-face irradiance on all meters.Photo 2: instruments, module shorted, before the sheet goes on.
- 4 · Deploy Sheet on, short in place, 10 s stabilisation: all instruments read at once, including under-sheet irradiance. BT270 re-zero: after carrying the 8–9.5 A short, the BT270 holds a residual offset (seen as −31 mA once the current collapsed). Before reading [31] it is taken off the conductor, zeroed, and clamped back on.Photo 3: instruments, sheet on, after the 10 s hold and readings.
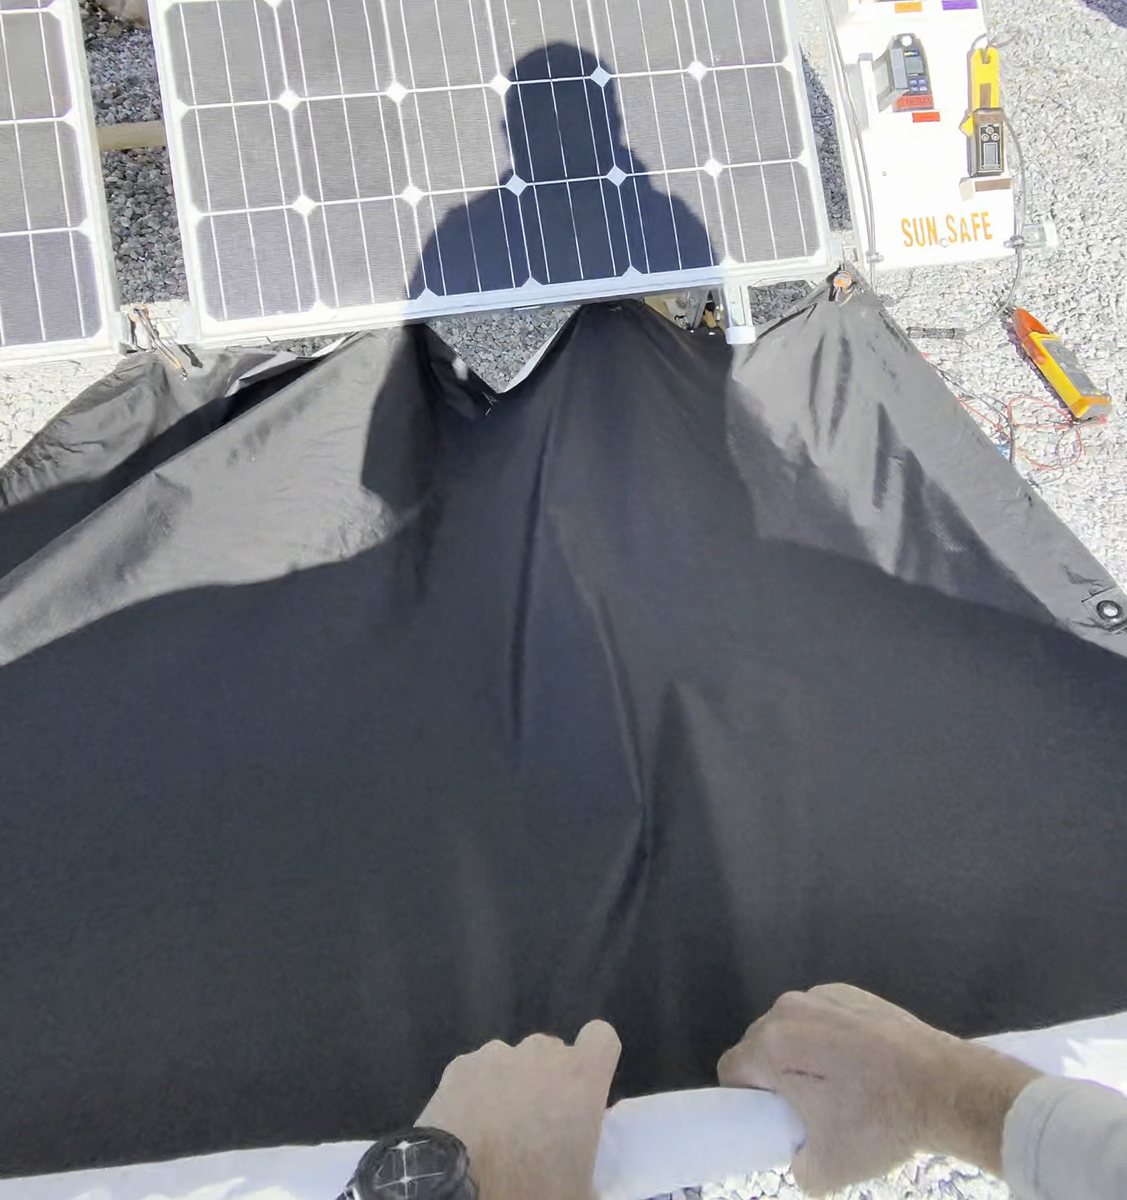
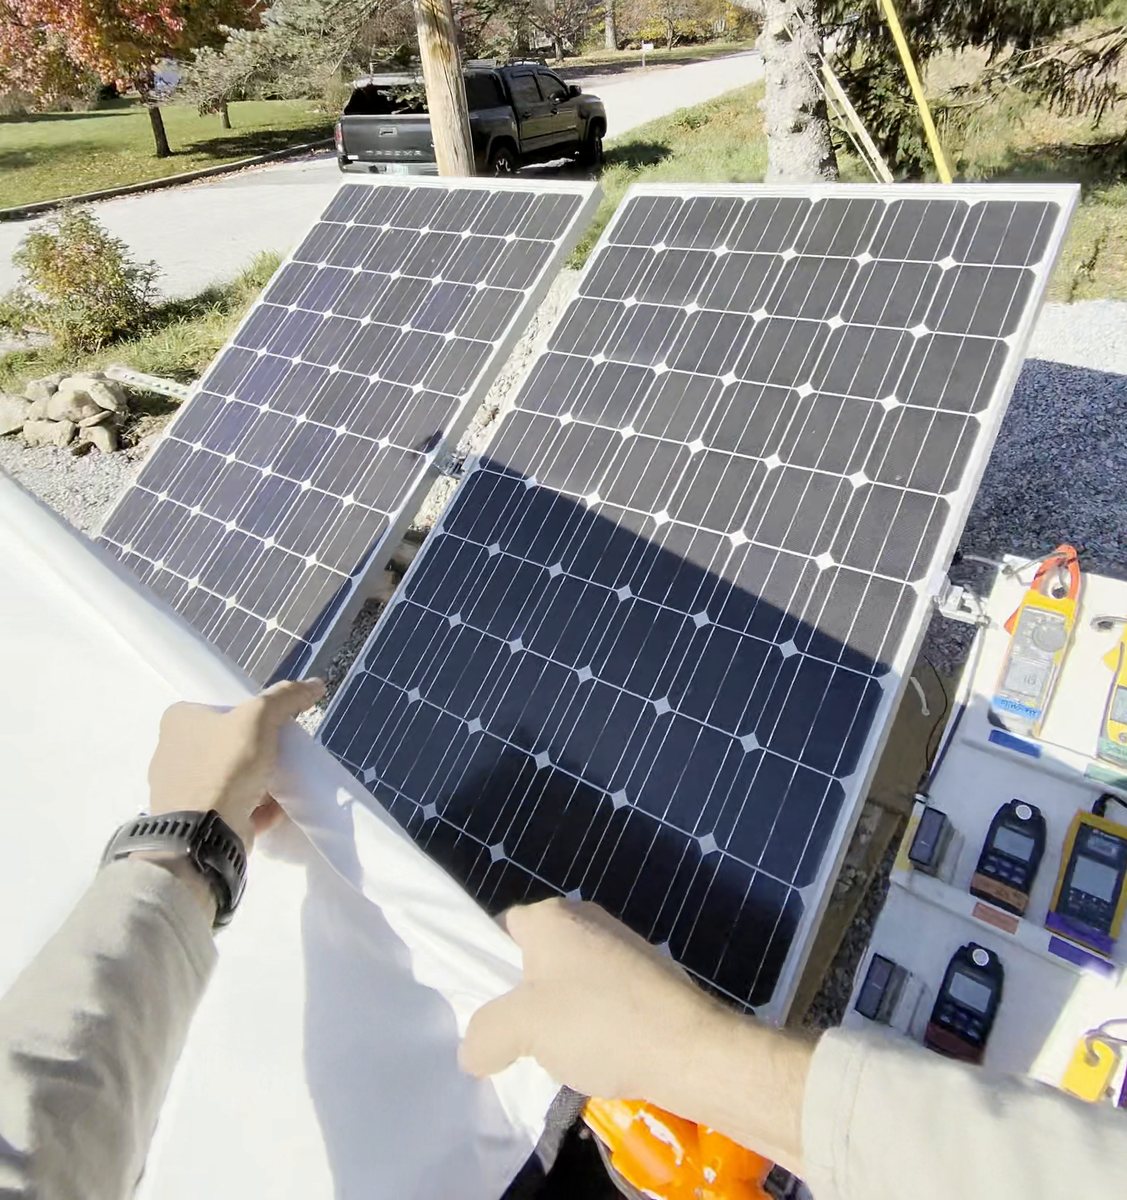
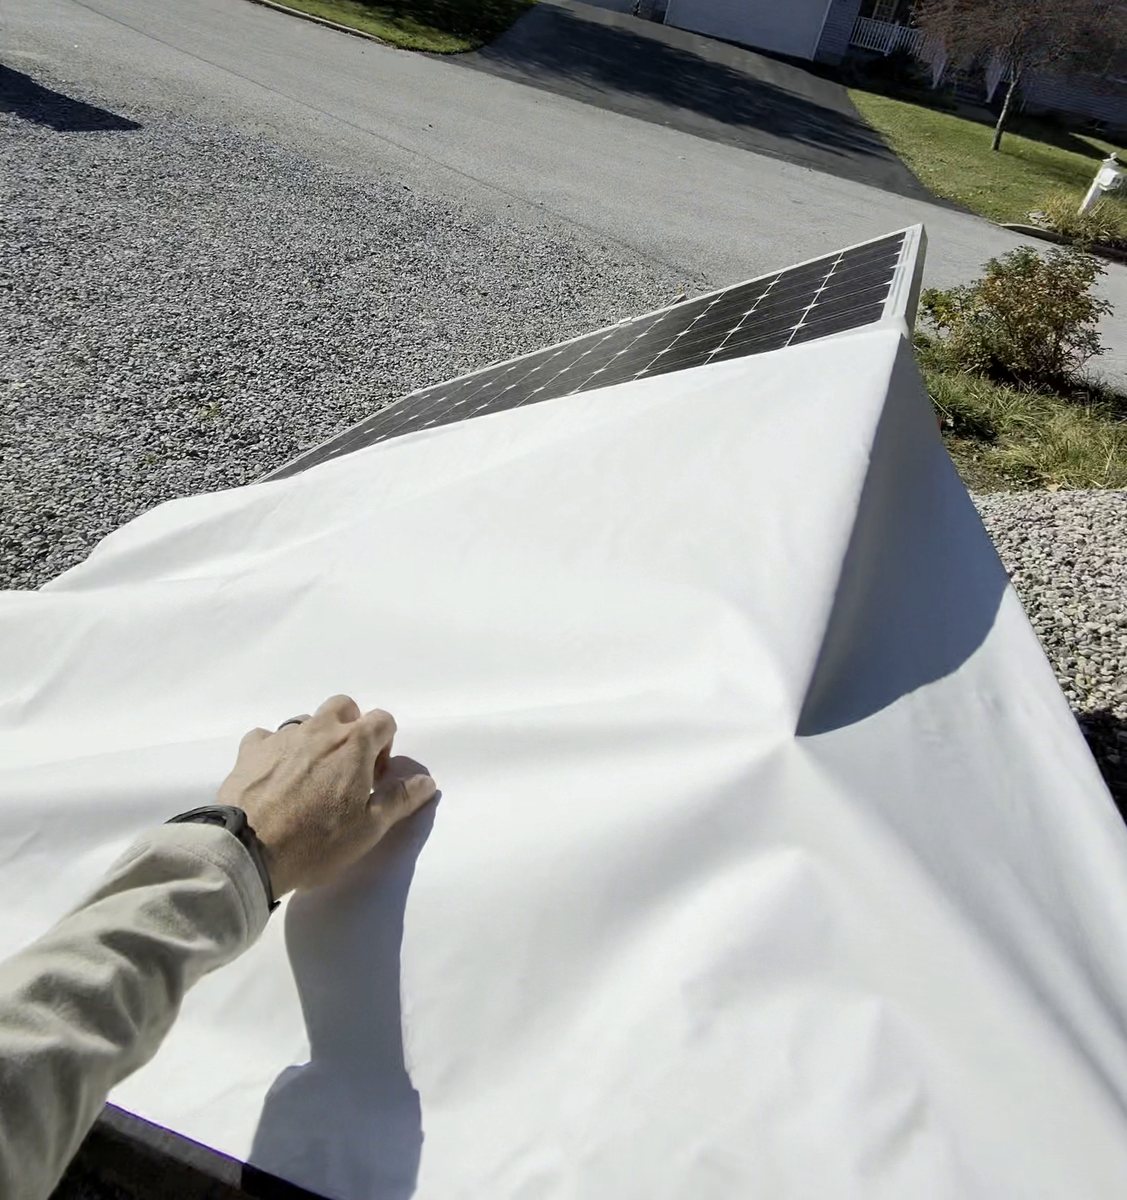
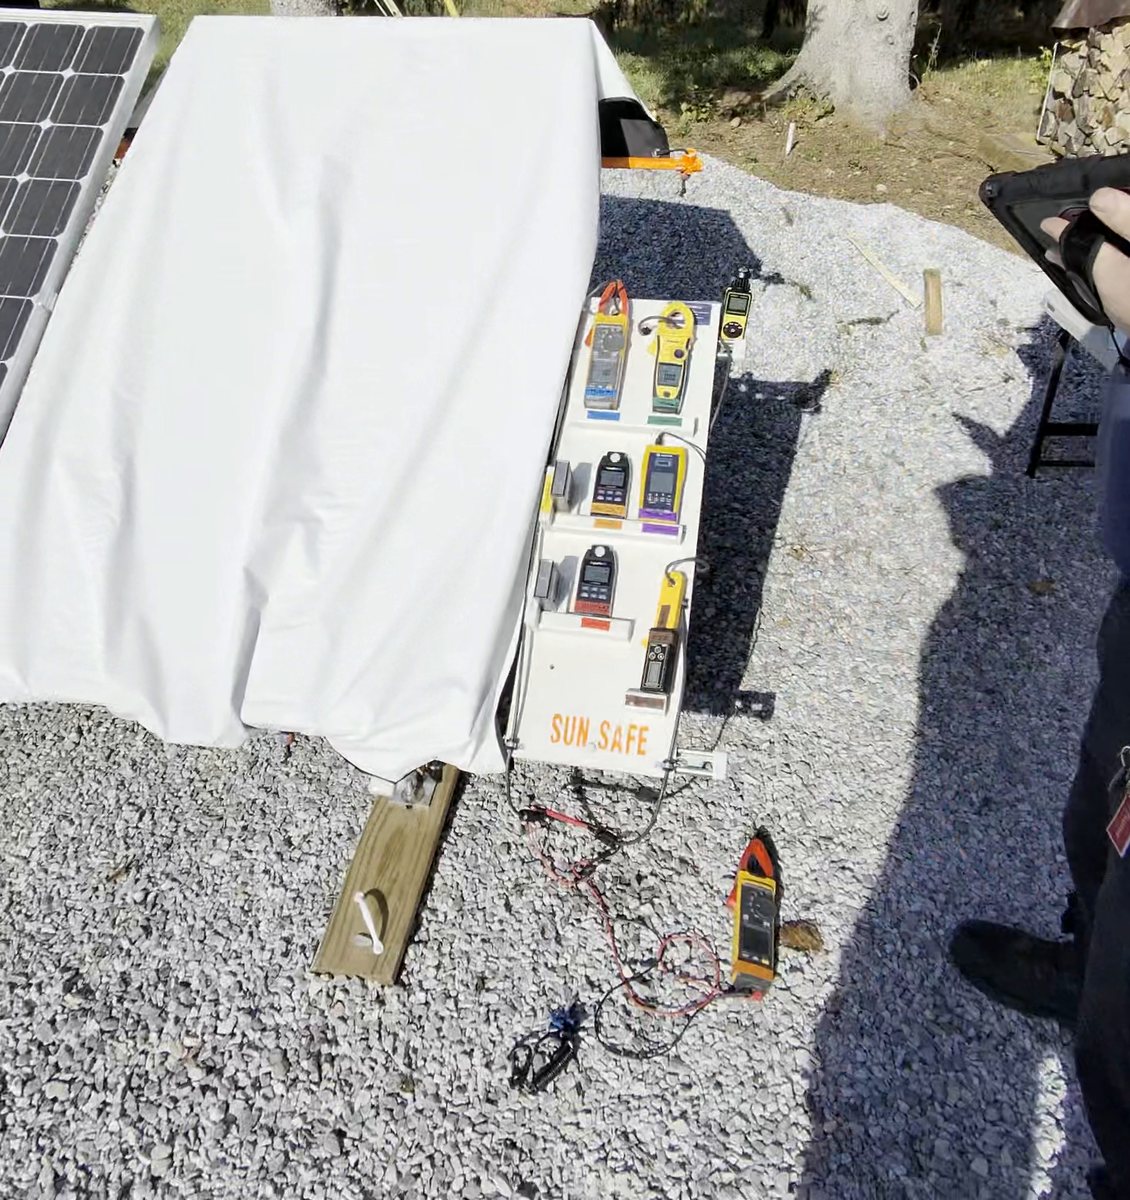
Deployment, Trial 005 · stowed, pulled up, over the top, deployed. Stills from the body camera, Oct 22, 2026, 2:03–2:11 pm. - 5 · Disconnect The step the sheet exists for: with current collapsed below the gate, the string is disconnected safely.
- Disconnect with the sheet on. The sheet stays on for every reading in this step.
- Read each clamp on the open conductor: a known 0 A. Its reading is that meter’s offset, the floor its Section 4 reading is judged against. Fluke ≥ 200 mA = re-zero.
- Record Voc under the sheet with cell and air temperature, then remove the sheet.
- 6 · Observe Sky, wind, anomalies, any VOID reason.
- 7 · Sign off Side 2 worked from the boxes; technician and supervisor sign; PDF emailed (up to two copies).Portraits: technician and supervisor / witness, at sign-off.
Instruments
| Tape | Instrument | Measures | Key spec | Datasheet |
|---|---|---|---|---|
| Blue | Fluke 393 FC | Shorted / open-string current | 0.1 A res., 2% + 5 digits | |
| Green | Seaward Solar Power Clamp | Second clamp, different make | ±(1.5% + 0.2 A) | Seaward |
| Brown | AUTOOL BT270 | Authoritative clamp, 1 mA res. | ±2% + 5 digits | Specs |
| Yellow / white | Daystar DS-05A (#1 ambient, #2 under sheet) | Irradiance, poly-Si cell | 0–1999 W/m², ±3% | |
| Orange / red | AquaHorti AH-SOL (#1, #2) | Irradiance, second technology | W/m²; range and accuracy not published | Specs · Manual |
| Purple | Seaward Solar Survey 200R | Ambient + cell / air temperature | 100–1250 W/m², PV reference cell | |
| — | Aiomest AI-881M | Wind gust | ~0.7–42 m/s (seller) | Listing |
Near zero amps, published DC accuracy is about ±0.5 A for the Fluke and ±0.2 A for the Seaward clamp, wider than the 125 mA gate. The BT270 (±5 mA) is the clamp that resolves the gates, so Stage 1 (S1) also requires each meter’s zero to be recorded. Re-zero after the short: after carrying the short, the BT270 held a residual zero offset (it read −31 mA once the 9 A short collapsed). The BT270 was re-zeroed off the conductor before the sheet-on reading [31] in all seven trials; the zero check [34] then shows how well that zero held. The Fluke and Seaward clamps were not re-zeroed, which likely explains the Fluke’s 0.1–0.2 A readings on Aug 29.
Pass criteria
The trial log scores each trial in three stages: Stage 1 (S1) current, Stage 2 (S2) light, Stage 3 (S3) agreement between the two. A trial passes only if all three pass. If the validity checks fail, the trial is VOID (not counted), not FAIL.
- ValiditySun ≥ 800 W/m²
- DayStar #1 and AH-Sol #1, sheet on, each ≥ 800 W/m². That’s NOCT/NMOT test sun [11], so every trial is run in real working sun.
- ValidityWind gust ≤ 12 m/s
- Over 12 m/s = VOID. A Sun Safe protocol limit set before testing; no published source.
- Stage 1 (S1) · currentEach clamp < 125 mA
- Fluke 393, Seaward and BT270, sheet on. An 8–9.5 A short has to drop to the meters’ own floor, not just come down. On a clamp reading in amps, 0.10 A is noise, 0.11 A still passes, 0.13 A fails. The Fluke may read at or below its own zero.
- Stage 2 (S2) · lightUnder the sheet < 7 W/m²
- DayStar #2 and AH-Sol #2. At 7 W/m² even a 14 A module (CS6W-585T [21]) stays under 125 mA (98 mA) [5].
- Stage 2 (S2) · lightOD ≥ 2.3 (target 2.5)
- OD = −log10([29] ÷ [26]). 2.3 holds 1,400 W/m² design-basis sun down to 7 W/m² [1].
- Stage 3 (S3) · agreement4a vs DayStar #2
- Light calculated from current, [31] × 1000 ÷ 8710, must be within 2.0 W/m² or 30% of [29], whichever is bigger. Current and light have to tell the same story. How it works
- RecordBT270 < 40 mA
- NFPA 70E 2027 draft dc shock threshold, “100 volts and 40 milliamperes” [7]; UL 2011’s “Lock On” band starts above 40 mA [1]. The source can’t deliver more current than the clamp reads.
- RecordMeter zero, open string, < 125 mA
- Each clamp read on the disconnected conductor, a known 0 A. Fluke at 200 mA = re-zero.
- RecordVoc reduction, %
- (1 − [35] ÷ [12]) × 100. A measured byproduct that shows how far the photocurrent collapsed. No claim of voltage collapse; not a pass gate.
Back-calculation: irradiance from current
- The module is its own light meter. At short circuit, Isc is proportional to irradiance [5], so the sheet-on current can be run backwards to the light that produced it.
- Formula (row 4a), fixed before testing. Light under the sheet = [31] × 1000 ÷ 8710. 8,710 mA is the test module’s nameplate Isc at 1,000 W/m². The constant is never adjusted to fit trial data.
- Independent check (row 4b). The back-calculated light is compared with DayStar #2 under the sheet [29], a separate instrument on a separate principle. Pass if the gap is within the larger of 2.0 W/m² or 30% of [29].
- Why it matters. Current and light are measured by different instruments. Agreement means the sheet blocked the light and the current collapsed for the same reason, not from a meter fault.
- Worked example, trial 007. [31] = 4 mA → 4 × 1000 ÷ 8710 = 0.46 W/m². DayStar #2 read 000. Gap 0.46 W/m² ≤ 2.0 → PASS.
Readings as recorded. Ranges (e.g. “5–7”) are scored at the higher value.
Every formula, explained
Worked examples use trial 007 (Oct 22): [26] 818 W/m², [29] 000, [31] 4 mA, [23] 7.6 A, [12] 36.8 V, [35] 8.3 V.
Side 2 formulas
- Amps to milliamps (2a, 2b, 2d)
- mA = A × 1000. The Fluke and Seaward read in amps; the gates are in mA. 0.12 A × 1000 = 120 mA.
- Ranges (all rows)
- A fluctuating reading recorded as a range, e.g. “5–7”, is scored at the higher value (7). Conservative: never rounds in the sheet’s favour.
- Optical density, OD (3c)
- R = [29] ÷ [26] · OD = −log10(R)
What it is. A way to rate how much light the sheet stops, counted in powers of ten. [12]
How it works. First divide the light under the sheet by the light outside. That’s R, the fraction that gets through. Then take −log10. All log10 asks is “10 to what power gives this number?” 0.001 is 10−3, so log10(0.001) = −3, and the minus sign in front flips it to OD 3.
OD 1 1 in 10 gets through (10%) OD 2 1 in 100 (1%) OD 3 1 in 1,000 (0.1%) Why use it instead of percent. Percent blocked bunches up near 100%. 99.5% and 99.9% look almost the same, but the first lets five times as much light through. OD spreads that out: every +1 is ten times less light.
The “≥” sign. DayStar #2 reads in whole W/m², so 000 means “somewhere under 1.” Plugging in 1 gives the worst case, and the real OD is at least that. Trial 007: 1 ÷ 818 = 0.00122 → OD ≥ 2.91, so no more than 1 part in 818 got through.
What it implies. When [29] reads 000, the OD number is set by how bright the sun was, not by the sheet: a brighter day gives a higher “≥.” These are floors, not measurements of the sheet’s true OD, which the meter can’t resolve.
Second pair. The same formula works on the AH-Sol pair: OD = −log10([30] ÷ [27]). The AH-Sol reads in 0.1 W/m² steps, so it gives an actual value instead of a floor. Side 2 scores OD from the DayStar pair (row 3c); the Results page shows both, low and high, for comparison. Phase 1: AH-Sol 2.63–2.83, DayStar ≥ 2.91–3.02.
- Percent of light blocked
- % blocked = (1 − 10−OD) × 100
This runs OD backwards. 10−OD turns OD back into the fraction that gets through; 1 minus that is the fraction stopped. Trial 007: 10−2.91 = 0.00123 → 1 − 0.00123 = 0.99877 → 99.87% blocked (at least).
OD 2.3 = 99.5% · OD 2.91 = 99.87% · OD 3 = 99.9%.
- Light from current (4a)
- [31] × 1000 ÷ 8710 (same as mA ÷ 8.71)
Calculated, not read. 4a is worked out from a measurement, the BT270 sheet-on current [31]; no meter reads it directly.
What it is. Using the module as its own light meter. Short-circuit current tracks the light on the cells [5]: double the sun, double the Isc.
How it works. The nameplate says 8.71 A (8,710 mA) at 1,000 W/m². So every 1 W/m² of light makes 8.71 mA. Divide the sheet-on current by 8.71 and you get the light that reached the cells. Trial 007: 4 mA ÷ 8.71 = 0.46 W/m².
What it implies. It gives a second, independent estimate of the light under the sheet, from a current clamp instead of a light meter. The 8.71 is fixed from the nameplate and is never tuned to fit the trials. Near zero it is limited by the clamp: a few mA of clamp offset is about half a W/m², which is why 4b allows 2.0 W/m². More
- Agreement and tolerance (4b)
- |4a − [29]| ≤ larger of 2.0 W/m² or 30% of [29]
Calculated, not read. 4b compares a calculation (4a) with a measurement (DayStar #2, [29]) and returns PASS or FAIL.
What it is. A cross-check between the two routes to the same answer: light read by DayStar #2, and light worked out from current (4a). If the sheet really stopped the light, both should be small and close together.
How it works. The vertical bars mean “size of the difference, ignoring plus or minus.” The allowance is whichever is bigger: 2.0 W/m², because near zero the meters move in 1 W/m² steps, or 30% of [29], for differences between instruments at higher readings (a Sun Safe protocol choice, set before testing; no published source). Trial 007: |0.46 − 0| = 0.46 ≤ 2.0 → PASS.
What it implies. With DayStar #2 at 000, 4b fails if the sheet-on current goes above 17.4 mA (2.0 × 8.71). A fail would mean current is getting made that the light meter isn’t seeing: a gap at the edge, light leaking in where the meter isn’t, or a meter fault. Agreement means the current collapsed because the light was blocked.
- Voc reduction (5a)
- (1 − [35] ÷ [12]) × 100How much open-circuit voltage fell with the sheet on. Trial 007: 8.3 ÷ 36.8 = 0.2255 → (1 − 0.2255) × 100 = 77.4%. Record only, and no claim of voltage collapse: voltage never reaches zero in dim light, so current is the safety measure. The drop is a measured byproduct that shows how far the photocurrent collapsed: at very low light the cells’ shunt (leakage) resistance, not the light, sets the voltage [19].
- Current reduction (R&D home)
- (1 − sheet-on mA ÷ shorted mA) × 100Trial 007: 4 ÷ 7,600 = 0.00053 → 99.94% (rounded down, never up to 100%).
Where the limits come from
- 7 W/m² under the sheet
- current = Isc × G ÷ 1000
The same proportion as 4a, run forwards. At 7 W/m² under the sheet, a large 14.00 A module (Canadian Solar CS6W-585T [21]) would make 14.00 × 7 = 98 mA, still under the 125 mA gate. The test module (8.71 A) makes 61 mA. So 7 W/m² is set to protect modules much bigger than the one tested.
- OD 2.3 minimum
- OD = −log10(7 ÷ 1,400) = 2.30
Works out how dark the sheet has to be to hold the light under it to 7 W/m² on the brightest design day. 1,400 W/m² is the design-basis sun, the cloud-edge peak UL 2011 cites [1]. 7 ÷ 1,400 = 0.005 (half a percent gets through) → OD 2.30.
- 125 mA and 40 mA
- 125 mA: field measurement-noise gate (a clamp reading 0.10 A is noise; 0.13 A fails). 40 mA: NFPA 70E draft dc shock threshold [7].
From the test module to any monofacial module
Monofacial modules only. The sheet blocks light from the front. A bifacial module also collects light on its rear side, which a front cover can’t suppress, so bifacial modules are untested and outside these results. Every module used below has an opaque backsheet.
- Step 1: what fraction of the light the sheet lets through
- Gunder = [31] ÷ 8.71 · T = Gunder ÷ [26]
The trial measures the sheet on the 8.71 A test module. Its current under the sheet [31], divided by 8.71 mA per W/m² (row 4a, from the test unit’s nameplate), gives the light reaching the cells. Dividing by the ambient sun [26] gives T, the fraction the sheet lets through. The 8.71 is used only here, to read the sheet; it is never applied to another module.
Trial 005: 11 ÷ 8.71 = 1.263 W/m² · T = 1.263 ÷ 847 = 0.00149 (about 1 part in 670).
- Step 2: the same sheet on a different monofacial module
- I (mA) = Isc (A) × T × Gsun (W/m²)
Short-circuit current rises in proportion to the light on the cells [5], and a passive cover passes the same fraction at any sun level (Beer-Lambert [12]). So the light under the sheet is T × Gsun, and any module makes its own Isc (in amps) times that light, in milliamps. Here Isc is the other module’s datasheet value.
Trial 005 on the largest monofacial module used, 18.62 A [24], on the 1,400 W/m² design day: 18.62 × 0.00149 × 1,400 = 38.9 mA.
- Step 3: the sun level that reaches a limit
- Gsun for 5 W/m² under the sheet = 5 ÷ T · Gsun for 40 mA = 40 ÷ (Isc × T)
Turn step 2 around to ask how bright the sun would have to be. Trial 005: 5 ÷ 0.00149 = 3,353 W/m² before 5 W/m² gets under the sheet; 40 ÷ (18.62 × 0.00149) = 1,441 W/m² before an 18.62 A module reaches 40 mA. The table below does this for every trial.
- How the requirements line up
-
1,400 W/m² design day [1] Brightest sun the limits are built around 5 W/m² under the sheet 5 ÷ 1,400 = 0.00357 → OD = −log10(0.00357) = 2.45 100 mA 18.62 A × 5 W/m² = 93.1 mA on the largest monofacial module; 14.00 A × 5 = 70.0 mA [21] 40 mA 40 ÷ 18.62 = 2.15 W/m² under the sheet → 2.15 ÷ 1,400 = 0.00153 → OD 2.81 Worst trial (005) T = 0.00149 → OD = −log10(0.00149) = 2.83, so 40 mA is reached at 1,441 W/m², just above the design day Sun, light under the sheet and module current describe one requirement three ways: the 1,400 W/m² design day, 5 W/m² under the sheet and 100 mA on the largest monofacial module agree to within about 7%. The worst trial sits right at the next level down, 40 mA on that module at the design day, with no margin to spare.
- Limits of this math
- Transmission is assumed constant at any sun level; Phase 1 tested up to 1,055 W/m² only.
- Different cell types respond slightly differently to the filtered light under the sheet; that difference is not measured here.
- Trial 005’s 11 mA is on a clamp good to about ±5 mA (Instruments), so its 1,441 W/m² could sit either side of the design day.
- Monofacial only (see note above).
Sun level (W/m²) at which each limit would be reached, from each trial’s own T. Ranges in [31] are scored at the higher value. Compare: 1,400 design day [1]; 1,466–1,528 measured cloud-edge peaks [2] [3]; 1,832 highest in the cited literature [4].
Datasheet: largest monofacial module used (Trina Vertex TSM-DE21)
| Module | Trina Solar Vertex TSM-DE21, 650–670 W |
|---|---|
| Construction | Backsheet monocrystalline module, white backsheet (opaque rear; monofacial) |
| Isc at STC by class | 650 W: 18.44 A · 655 W: 18.48 A · 660 W: 18.53 A · 665 W: 18.57 A · 670 W: 18.62 A (used) |
| Datasheet | Trina Solar, Vertex DE21, TSM_EN_2022_A [24] · PDF |
| Also used | Canadian Solar CS6W-585T, Isc 14.00 A [21] (backsheet construction to be confirmed from the datasheet) |
Statistics on the Results page
- Mean
- The average: add the values, divide by how many. Example 2, 4, 6 → 12 ÷ 3 = 4. [22]
- SD, standard deviation
- The typical distance of a trial from the mean, in the same units. Square each distance from the mean, add, divide by n − 1, take the square root. Example: distances −2, 0, +2 → 4 + 0 + 4 = 8 → 8 ÷ 2 = 4 → √4 = 2. (n − 1 rather than n because the trials are a sample, not every possible trial.) [22]
- CV, coefficient of variation
- CV = SD ÷ Mean × 100The spread as a percent of the average, so measurements of different sizes can be compared. Example: 2 ÷ 4 × 100 = 50%. [23] The BT270’s sheet-on readings are a few mA on a 1 mA clamp, so their CV is high even though every one is far under 40 mA; OD’s CV is low mainly because most ODs are “≥” floors set by the day’s sun, which only varied from 816 to 1,041 W/m²; it doesn’t by itself show the sheet blocks identically every time.
- Min, Max, n
- Lowest trial, highest trial, and how many trials have that value.
Where the thresholds come from
Light through the sheet
Beer-Lambert law (Bouguer 1729, Lambert 1760, Beer 1852) [12].
Current from light
Short-circuit current scales with irradiance [5] (pp. 9–12, Eqs. 1, 3, 7; Figs. 3–4), so a measured current gives back the light that made it.
Current under the sheet at each sun level, for the Phase 1 module and a high-current module (Canadian Solar CS6W-585T, Isc 14.00 A):
Sun levels: 800 W/m² Phase 1 floor [11]; 1,000 STC (IEC 60904-3); 1,400 design basis, a Sun Safe choice based on the value reported by UL 2011 [1]; measured cloud-enhancement peaks above it: 1,466 San Diego [2], 1,528 Norway [3], 1,832 Andes [4]. These are reported peaks, not absolute maxima.
Limitations and open items
- Sample size: n = 7, one prototype (unit 004), one module, one site, two days (Aug 29 and Oct 22, 2026). The Oct 22 trials were witnessed on site by Mark Foote, EMS Coordinator / Fire Captain, Killington Fire & Rescue, and photographed. No statistical claim beyond these trials.
- OD is a lower bound: DayStar #2 resolves 1 W/m², so at ~1,000 W/m² ambient the largest measurable OD is ≈ 3.0. Reported OD 2.91–3.02 sits at that limit; true OD may be higher.
- Clamp accuracy near zero: only the BT270 (±5 mA) resolves the 125 mA gate; Fluke and Seaward clamp readings are recorded but not decisive.
- Isc constant: Side 2 uses 8.71 A from the test unit’s own nameplate (photo). The Suniva datasheet lists 9.05 A for this model, and the OD justification document uses 9.05 A. The lower value makes the light-from-current check (4a) read slightly high, which is conservative.
- Calibration: instruments are as-purchased; no traceable calibration certificates yet. AH-Sol range and accuracy are not published by the maker.
- Spectral match: both under-sheet meters are silicon-based, matching the module’s response; sheet transmission has not been measured by spectrometer.
- Above 1,400 W/m²: at OD 2.3, under-sheet light exceeds 7 W/m² (table above); the 2.5 target covers to ~2,200 W/m².
- Not yet tested: damaged or broken-glass modules, edge sealing on framed arrays, wind loading, durability and repeat deployments, independent laboratory testing.
- 125 mA basis: a measurement-noise gate proving the short collapsed to the meter floor, not an arc or shock limit. Minimum arc current is material-specific (carbon 10–30 mA) and intermittent arcing has been reported below traditional minimums [10]. The safety reference is the 40 mA NFPA 70E line [7], which every trial cleared (max 11 mA).
- Scope: the sheet reduces photocurrent at the module. It is not a rapid-shutdown device, a listed product or a substitute for verification with a meter.
References
- Backstrom, R. & Dini, D. A. Firefighter Safety and Photovoltaic Installations Research Project. Underwriters Laboratories, Nov 29, 2011. DOI 10.54206/102376/VIYV4379. Shock bands 0–2 / 2.1–40 / 40.1–240 / >240 mA (body current), PDF p. 23; 1,400 W/m² (“can approach 1400 W/m²,” citing D. R. Brooks, Drexel), PDF p. 56; tarps and foam §9.1, Table 17, PDF p. 58. PDF
- Lappalainen, K. & Kleissl, J. “Analysis of the cloud enhancement phenomenon and its effects on photovoltaic generators based on cloud speed sensor measurements.” J. Renewable Sustainable Energy 12(4), 043502, 2020. DOI 10.1063/5.0007550. 1,466 W/m², abstract. Article
- Yordanov, G. H., Midtgård, O.-M., Saetre, T. O., Nielsen, H. K. & Norum, L. E. “Overirradiance (Cloud Enhancement) Events at High Latitudes.” IEEE J. Photovoltaics 3(1), 271–277, 2013. DOI 10.1109/JPHOTOV.2012.2213581. 1,528 W/m². IEEE
- Emck, P. & Richter, M. “An Upper Threshold of Enhanced Global Shortwave Irradiance in the Troposphere Derived from Field Measurements in Tropical Mountains.” J. Appl. Meteor. Climatol. 47(11), 2828–2845, 2008. DOI 10.1175/2008JAMC1861.1. 1,832 W/m², p. 2828. Article
- King, D. L., Boyson, W. E. & Kratochvil, J. A. Photovoltaic Array Performance Model. Sandia National Laboratories, SAND2004-3535, 2004. DOI 10.2172/919131. pp. 9–12, Eqs. (1), (3), (7), Figs. 3–4. PDF (OSTI)
- NFPA 70, National Electrical Code, 2023: 690.12 rapid shutdown; 690.13(B) disconnect marking. NEC 2014 690.12 wording as quoted in [8], not 2023 wording. codebook / standard, paid
- NFPA 70E, 2027 edition, First Draft (draft text, not the final edition): FR-102, proposed Article 390 “Safety-Related Requirements: Photovoltaic Systems”: 390.2(2) “100 volts and 40 milliamperes,” 390.3, 390.4(A). First Revision statements (PDF)
- Brooks, B. & Rogers, J. “Rapid Shutdown of PV Systems.” IAEI Magazine, Jan/Feb 2015 (online Jan 22, 2015). Sections “Background,” “So what exactly does Section 690.12 require?,” “Why 30 volts?” Article
- Namikawa, S. Photovoltaics and Firefighters’ Operations: Best Practices in Selected Countries. IEA PVPS Task 12, T12-09:2017, April 2017. ISBN 978-3-906042-60-2. p. 8 §1.3 and Table 1.2; §4.3 from p. 24. PDF (IEA)
- Deringer-Ney. Ney Contact Manual, revised 1st ed. §1.9.2.3, pp. 23–25; Table 1-3 p. 25 (minimum arc current by material: carbon 0.01–0.03 A, gold 0.38–0.42 A, silver 0.4–0.9 A); p. 24: arcing “can still occur below the traditional Im and Vm values,” limiting current “generally below 100 ma.” PDF
- IEC 61215-2:2016, Terrestrial PV modules — Design qualification and type approval — Part 2: Test procedures. p. 13 §4.5–4.5.2 (NMOT: 800 W/m², 20 °C ambient, 1 m/s wind); p. 14 §4.6. codebook / standard, paid
- Optical density: T = 10−OD (Beer-Lambert). Swinehart, D. F. “The Beer-Lambert Law.” J. Chem. Educ. 39 (1962) 333. Also RP Photonics, “Optical Density”.
- Paiss, M. & Brooks, B. Understanding the Cal Fire Solar Photovoltaic Installation Guideline (webinar slides). PDF
- Grant, C. C. Fire Fighter Safety and Emergency Response for Solar Power Systems. NFPA Fire Protection Research Foundation, May 2010, rev. Oct 2013. PDF
- Fraunhofer ISE / TÜV Rheinland, PV fire-safety project and firefighter guideline, 2014. Project · Guideline (PDF)
- Williams, L. (Solar Developments Pty Ltd). Method for coating a solar panel. US 9,455,370 B2, Sep 27, 2016 (PVStop). Opacified peelable coating; claims output below “about 200 milliamps DC” (cl. 1, 13) and transmission below 0.1% (cl. 2); measure-and-recoat method (cl. 22). Google Patents · PVStop website
- McCune, C., Rice, M. K. & Wilson, S. R. PV stop potential voltage and hazard stop system. US 9,791,835 B2, Oct 17, 2017 (filed Mar 11, 2014; priority Mar 12, 2013). Control panel and paired junction boxes; relays switch off module output on a shutdown request; lockout to re-energize (cl. 1). Electronic shutdown, not light blocking. Google Patents
- HelioVolta. Unintended Consequences: Rapid Shutdown Devices and Safety in Commercial Rooftop Solar Systems, 2026. 74 high-risk RSD incidents, 2021 to early 2026 (40 melting/overheating, 13 contained fires, 21 rooftop fires). Sources: HelioVolta field inspections, third-party reports, legal filings. Reported in Zientara, B., pv magazine USA, Mar 23, 2026. Report · Article
- Reich, N. H., van Sark, W. G. J. H. M., Alsema, E. A., Lof, R. W., Schropp, R. E. I., Sinke, W. C. & Turkenburg, W. C. “Crystalline silicon cell performance at low light intensities.” Solar Energy Materials & Solar Cells 93 (2009) 1471–1481. DOI 10.1016/j.solmat.2009.03.018. Cells measured 3–1,000 W/m² (one cell to 0.01 W/m²); single-diode models fail to model the measured Voc decrease at low light (p. 1475); “the shunt resistance is particularly influential in lower irradiance intensities” (p. 1477). PDF (TNO/ECN)
- Suniva. Optimus Series: OPT 60 Cell Modules, datasheet SAMD_0016 Rev. 16, Jan 17, 2014. β Voc −0.335 %/°C. Datasheet Isc for the 255 W model is 8.96 A; this project uses the 8.71 A nameplate on the test unit (conservative). PDF
- Canadian Solar. TOPHiKu6 CS6W-585T, PV Module Product Datasheet V1.9_AU, Mar 2024. Isc 14.00 A at STC. Used as the large-module case for the 7 W/m² limit. PDF
- NIST/SEMATECH e-Handbook of Statistical Methods, §1.3.5.6 “Measures of Scale”: sample standard deviation with N − 1. NIST
- NIST Dataplot Reference Manual, “Coefficient of Variation”: CV = s ÷ x̄. NIST
- Trina Solar. Vertex: Backsheet Monocrystalline Module, TSM-DE21, 650–670 W, datasheet TSM_EN_2022_A, 2022. Isc 18.44–18.62 A at STC (670 W: 18.62 A). Largest monofacial module used in the calculations. PDF