Phase 1 results: seven trials, seven passes.
Across seven field trials on a shorted 255 W module, three on Aug 29 and four on Oct 22, 2026 (witnessed on site by the fire service), the sheet cut the module’s short-circuit current from 7.6–9.5 A to a few milliamps, every time, in full sun of 816–1,041 W/m². Two independent light meters under the sheet and three clamp meters on the conductor agreed on the result.
- 7 of 7 passed every stage of the test plan.
- Current with the sheet on: 2–11 mA (BT270, mean 6.7 mA): under the 40 mA dc shock threshold in the NFPA 70E 2027 draft, and under a tenth of the 125 mA pass gate.
- Current cut 99.86–99.97% from the shorted value.
- Light blocked: optical density 2.63–3.02 on both meter pairs, above the 2.3 minimum. The DayStar under the sheet read 0 W/m² in every trial; the AH-Sol read 1.3–2.4 W/m².
- Voltage fell 77–81% (mean 78.1%), from about 35 V to about 8 V, in the six trials with a starting reading.
- Cross-check: light under the sheet worked back from the current matched the meter to within 2 W/m² in every trial.
Each trial, chart and statistic is below; how it was measured is on the Method page.
Tests included
All tests tap to choose
Summary
Trials
Every box [1]–[38] plus Side 2 results for the selected tests.
Ranges recorded on the sheet (e.g. BT270 “5–7”) are scored at the higher value. “≥” = the under-sheet meter read 0, so 1 W/m² is used and OD is a lower bound. Open any trial in the field log for the full Side 1 and Side 2.
Archive
Open the archive all trials, newest first
Open shows the full Side 1, Side 2 and photos in the field log, read-only, with the PDF ready to download or share. Published trials are marked; trials saved only on this device can be deleted here.
Charts
Current with the sheet on, and the sun
Each brown bar is the current still flowing through the shorted module with the sheet on, read by the BT270. The gold line above it is the sun hitting the panel at that moment, so you can see the result was not just a cloudy day. The orange dashed line is the 125 mA pass gate; the navy dashed line is the 40 mA shock threshold in the NFPA 70E 2027 draft.
Example, Trial 005. Trial 005 had the highest current of all seven: 11 mA, with the sun at 847 W/m². That is about a quarter of the 40 mA line and under a tenth of the gate.
* Test log cells
BT270 [31] mA per trial (bars, left axis) · sun on the panel with the sheet on [26] (strip above, same trials) · 125 mA = Stage 1 (S1) gate · 40 mA = NFPA 70E 2027 draft dc shock threshold, recorded, not a Phase 1 gate
Optical density, both meter pairs
Optical density (OD) is how much sunlight the sheet stops, counted in powers of ten: OD 2 lets through 1 part in 100, OD 3 lets through 1 part in 1,000. Each trial has two bars because two different meter pairs measured it, one under the sheet against one in open sun. Higher is better; every bar needs to clear the orange 2.3 line.
Example, Trial 005. In Trial 005 the AH-Sol meter under the sheet read 2.1 W/m² while the one in the sun read 890 W/m². 890 ÷ 2.1 is about 424, so roughly 1 part in 424 got through: OD 2.63. The DayStar under the sheet read 0, so its bar (2.93) is a floor; the true value is at least that.
* Test log cells
DayStar pair −log10([29] ÷ [26]), a “≥” floor when [29] reads 0 (Side 2 row 3c) · AH-Sol pair −log10([30] ÷ [27]), calculated here for comparison · minimum 2.3, target 2.5
The sun, every meter
Three different sun meters were read three times in every trial: before the short, shorted with no sheet, and with the sheet on. Each dot is one reading; the color is the meter. The shaded box is the range from the lowest to the highest of all nine. A short box means the meters agreed and the sun held steady through the trial.
Example, Trial 005. In Trial 005 all nine readings fell between 847 and 902 W/m², a spread of 55 W/m², about 6%. The AH-Sol (orange) read highest at every stage, which it does in every trial: that is a steady difference between meters, not the sun changing.
* Test log cells
Ambient W/m² from DayStar #1, AH-Sol #1 and Seaward 200R at each stage: before the short [13] [14] [15], shorted with no sheet [18] [19] [20], sheet on [26] [27] [28]. Shaded band = spread between all of them.
Current, every clamp
Three different clamp meters measured the current twice in every trial: shorted with no sheet (open circle, top) and with the sheet on (filled dot, bottom). The scale jumps by ten at each gridline so amps and milliamps fit on one chart. The line between the two dots is the drop the sheet caused.
Example, Trial 005. In Trial 005 the three clamps read 7.9, 7.81 and 8.0 A with no sheet, within 0.2 A of each other. With the sheet on, the Fluke and Seaward read 0 (drawn on the 1 mA floor, below what they can resolve) and the BT270, which reads to 1 mA, read 11 mA.
* Test log cells and the Fluke readings
Fluke 393, Seaward clamp and BT270: shorted with no sheet [16] [17] [23] (open) and with the sheet on [24] [25] [31] (filled). Log scale; a 0 reading is drawn on the 1 mA floor. Sun for the same trials is in the chart beside it.
The Fluke’s 200 mA and 100 mA readings (Trials 1 and 3, Aug 29). These are meter offset, not current through the sheet. With the clamp off the conductor, its zero check [32] read 0.2 A in both trials, the same as or more than its sheet-on reading [24] (0.2 A in Trial 1, 0.1 A in Trial 3). Subtracting the zero gives 0 A both times. The Fluke 393 FC reads in 0.1 A steps and is rated ±(2% + 5 digits), about ±0.5 A at these levels, so 0.1–0.2 A is inside its own uncertainty. The Fluke and Seaward clamps were not re-zeroed on Aug 29; from Oct 22 the Fluke read 0.0 A, zero and sheet-on, in every trial. The BT270, which reads to 1 mA (±5 mA), read 2–8 mA in the same trials. Under the test plan, a Fluke reading at or below its own zero passes check 2a, and a zero of 200 mA or more means re-zero before the next trial (see Method).
Irradiance vs current collapse
Each trial is one vertical line: the open circle at the top is the current with the module shorted and no sheet, the filled dot at the bottom is the current with the sheet on. Left to right is how strong the sun was. The scale jumps by ten at each gridline, so the length of each line shows how many times smaller the current became.
Example, Trial 005. Trial 005 sits at 847 W/m² of sun: 8.0 A with no sheet, 11 mA with the sheet on. That is about 727 times less current, a 99.86% drop. Stronger sun (#1 and #2, right side) did not push the sheet-on current up.
* Test log cells
Each trial: shorted current before the sheet (open circle, highest of [16] [17] [23]) dropping to BT270 current with the sheet on (filled, [31]), placed by the sun with the sheet on [26]. Log scale: each gridline is 10×.
Statistics
N = . Trial 1 (Aug 29) has no Voc baseline, so Voc reduction covers the other trials. Its BT270 reading includes a 5 mA zero offset noted on the sheet (7 − 5 = 2 mA net); the table scores the raw 7 mA. Fluke readings at or below that meter’s own zero check pass 2a (Aug 29 trial 1: 200 mA vs a 200 mA zero).
Oct 22, 2026 testing
- Four trials, 004–007, Rutland, VT; prototype unit 004; tilt 34–35°, azimuth 195–218°.
- All four PASS: BT270 4–11 mA with the sheet on, under-sheet light 0 W/m² (DayStar #2), OD ≥ 2.91–2.95.
- Witnessed and signed on site by Mark Foote, EMS Coordinator / Fire Captain, Killington Fire & Rescue.
- Sky and instrument photos for each trial are in the field log.
- Numbering: the 00x scheme was adopted that day; the first trial was recorded as #1 and is published as 004.
- Open: 004 · 005 · 006 · 007
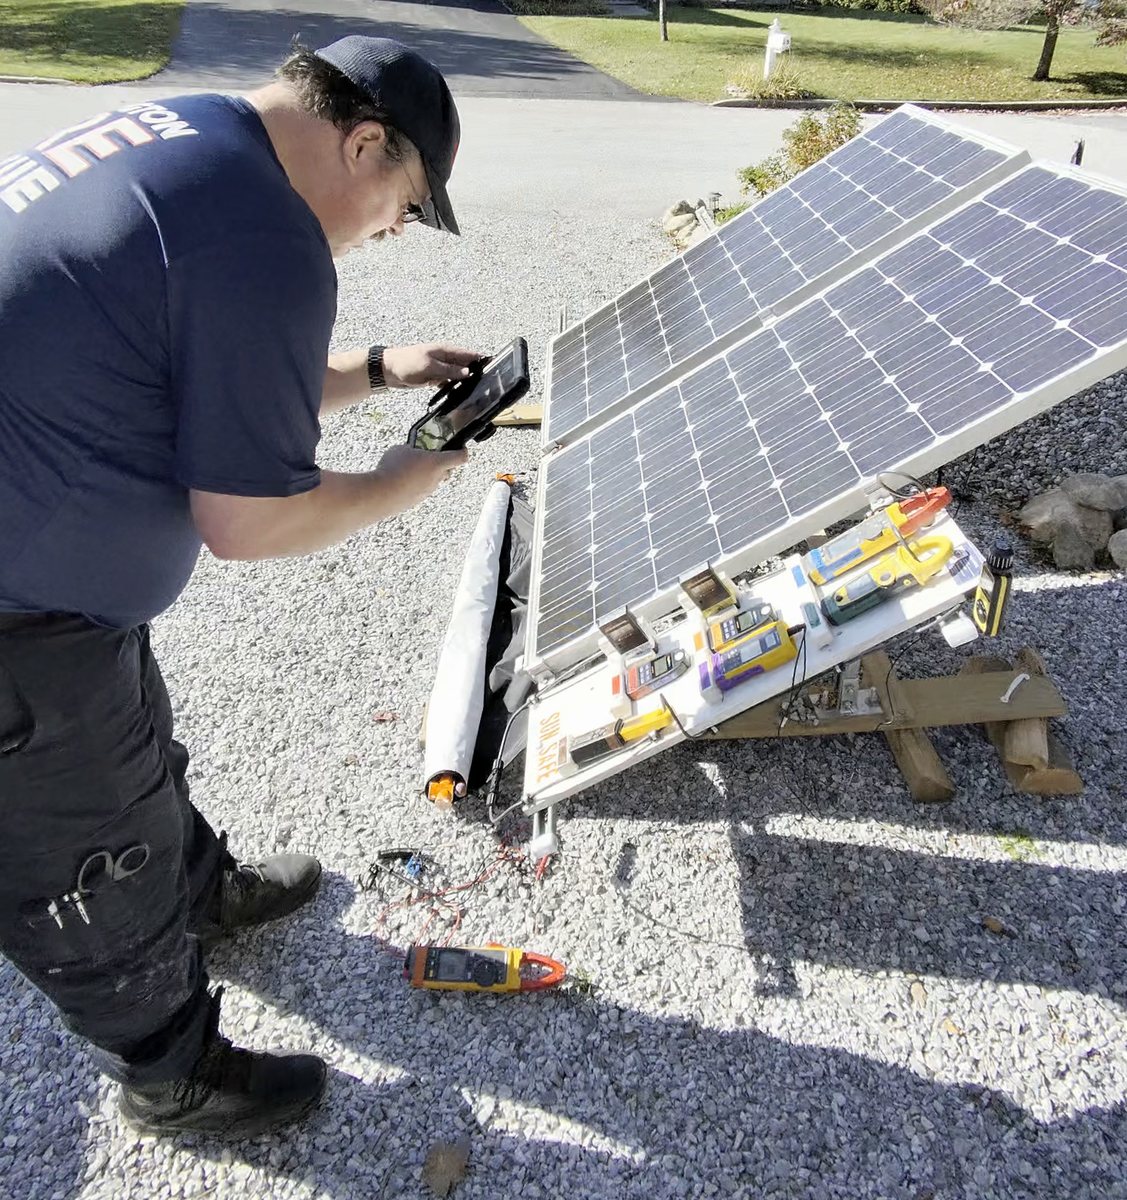
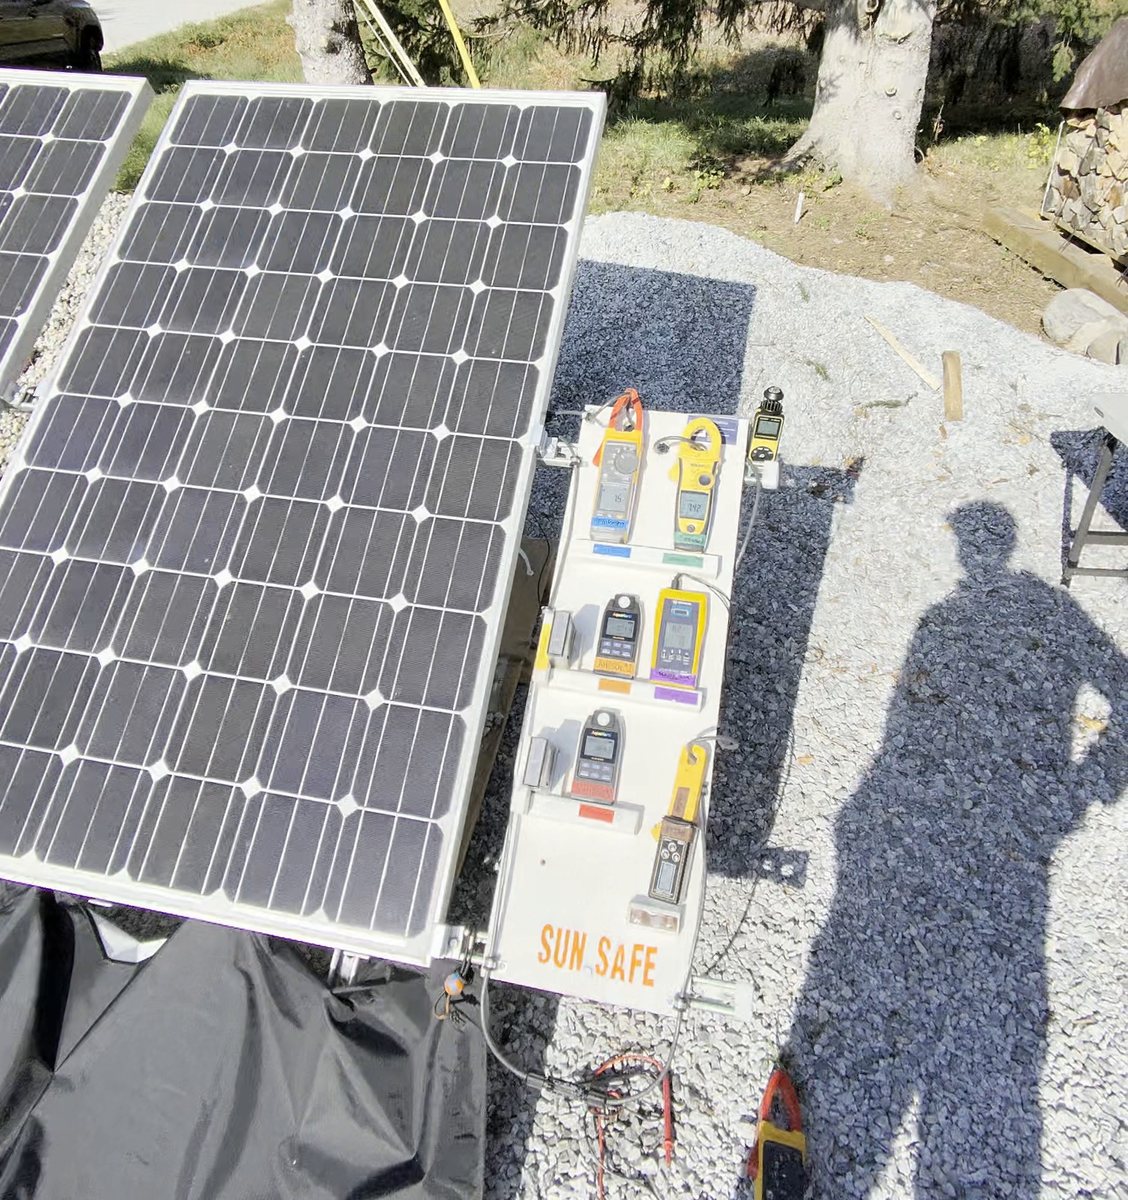
From the body camera: the witness entering readings during Trial 005, and the stand before the sheet in Trial 006.
Extrapolated: the largest module, full strings
What the sheet would do to the largest monofacial module in the calculations, on the brightest design day, alone and wired into strings for the three common system voltages. In series the voltage adds but the current stays the same, so the current collapses by the same factor in every string.
| Module | Trina Solar Vertex TSM-DE21, 670 W, monofacial (white backsheet) · datasheet |
|---|---|
| Isc (STC) | 18.62 A |
| Voc (STC) | 46.1 V |
| Max system voltage | 1,500 V DC |
|---|---|
| Design day | 1,400 W/m² (UL 2011): Isc = 18.62 × 1.4 = 26.07 A |
| Sheet on | 18.62 × 0.00149 × 1,400 = 38.8 mA · 46.1 × (8.3 ÷ 38.0) = 10.1 V per module |
| String | System | No sheet: voltage | No sheet: current | Sheet on: voltage | Sheet on: current |
|---|---|---|---|---|---|
| Single module | — | 46.1 V | 26.07 A | 10.1 V | 38.8 mA |
| 13 modules | 600 V | 599.3 V | 26.07 A | 130.9 V | 38.8 mA |
| 21 modules | 1,000 V | 968.1 V | 26.07 A | 211.5 V | 38.8 mA |
| 32 modules | 1,500 V | 1,475.2 V | 26.07 A | 322.2 V | 38.8 mA |
Example, 1,500 V string. With no sheet, a 32-module string on the design day sits at 1,475 V and can push 26.07 A through a short. With the sheet on, it would read about 322 V and 38.8 mA: the current about 670 times smaller, the voltage about 4.6 times smaller.
* Inputs and limits
No sheet: Isc scales with sunlight: 18.62 A × 1,400 ÷ 1,000 = 26.07 A. Voltage = modules × 46.1 V (nameplate Voc). Modules per string = system voltage ÷ 46.1 V, rounded down: 13, 21, 32 (no cold-weather correction, for comparison only).
Sheet on, current: I = Isc × T × G = 18.62 × 0.00149 × 1,400 = 38.8 mA, using the worst measured transmission (Trial 005, T = 0.00149), as on the Method page.
Sheet on, voltage: 10.1 V per module = 46.1 V × (8.3 ÷ 38.0), the highest sheet-on to nameplate ratio measured on the test module (Trial 007), carried over to this module.
Limits: Extrapolated from one test module; not measured on this module or on full strings. Transmission is assumed constant at any sun level; Phase 1 tested up to 1,055 W/m². Voltage under very low light depends on the cell type, so the sheet-on voltage is the least certain number here.